ORIGINAL RESEARCH

Antitumor effect of radiation therapy on orthotopic PDX models of human esophageal adenocarcinoma

Kiblitskaya AA, Goncharova AS, Anisimov AE, Snezhko AV, Dimitriadi SN, Maslov AA, Gevorkyan YA, Kolesnikov EN
About authors

National Medical Research Center of Oncology, Rostov-on-Don, Russia

Correspondence should be addressed: Alexandra A. Kiblitskaya
14 Liniya, 63, Rostov-on-Don, 344037; moc.liamg@dnaelabik

About paper

Author contribution: Kiblitskaya AA — data processing, manuscript preparation, technical editing, reference list, figures; Goncharova AS, Maslov AA — study concept and design, manuscript preparation; Anisimov AE — study concept and design, manuscript preparation, data acquisition, analysis and interpretation; Snezhko AV — content editing, manuscript preparation; Dimitriadi SN — data analysis and interpretation, technical editing; Gevorkyan YA — content editing; Kolesnikov EN — content and technical editing.

Ethical standards: the study fully complied with the principles of the Declaration of Helsinki; all requirements for animal housing were met; surgical interventions were conducted following the guidelines on the Care and Use of Laboratory Animals. The donors provided informed consent for their biological samples to be used in the study.

Received: 2021-09-16 Accepted: 2021-10-04 Published online: 2021-10-20
|
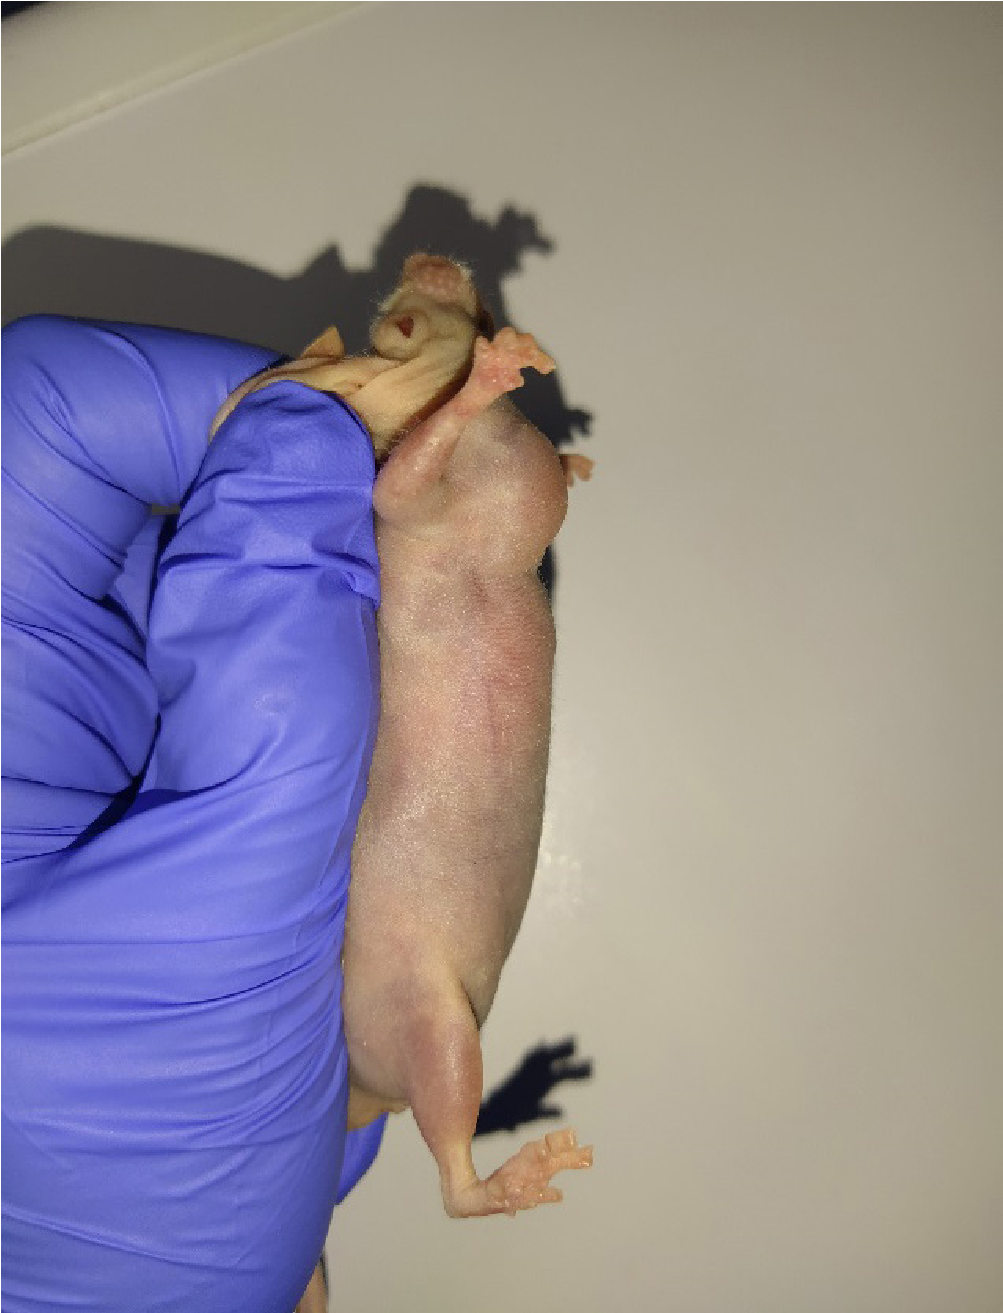
Fig. 1. The orthotopic PDX model of human esophageal adenocarcinoma (passage 6)
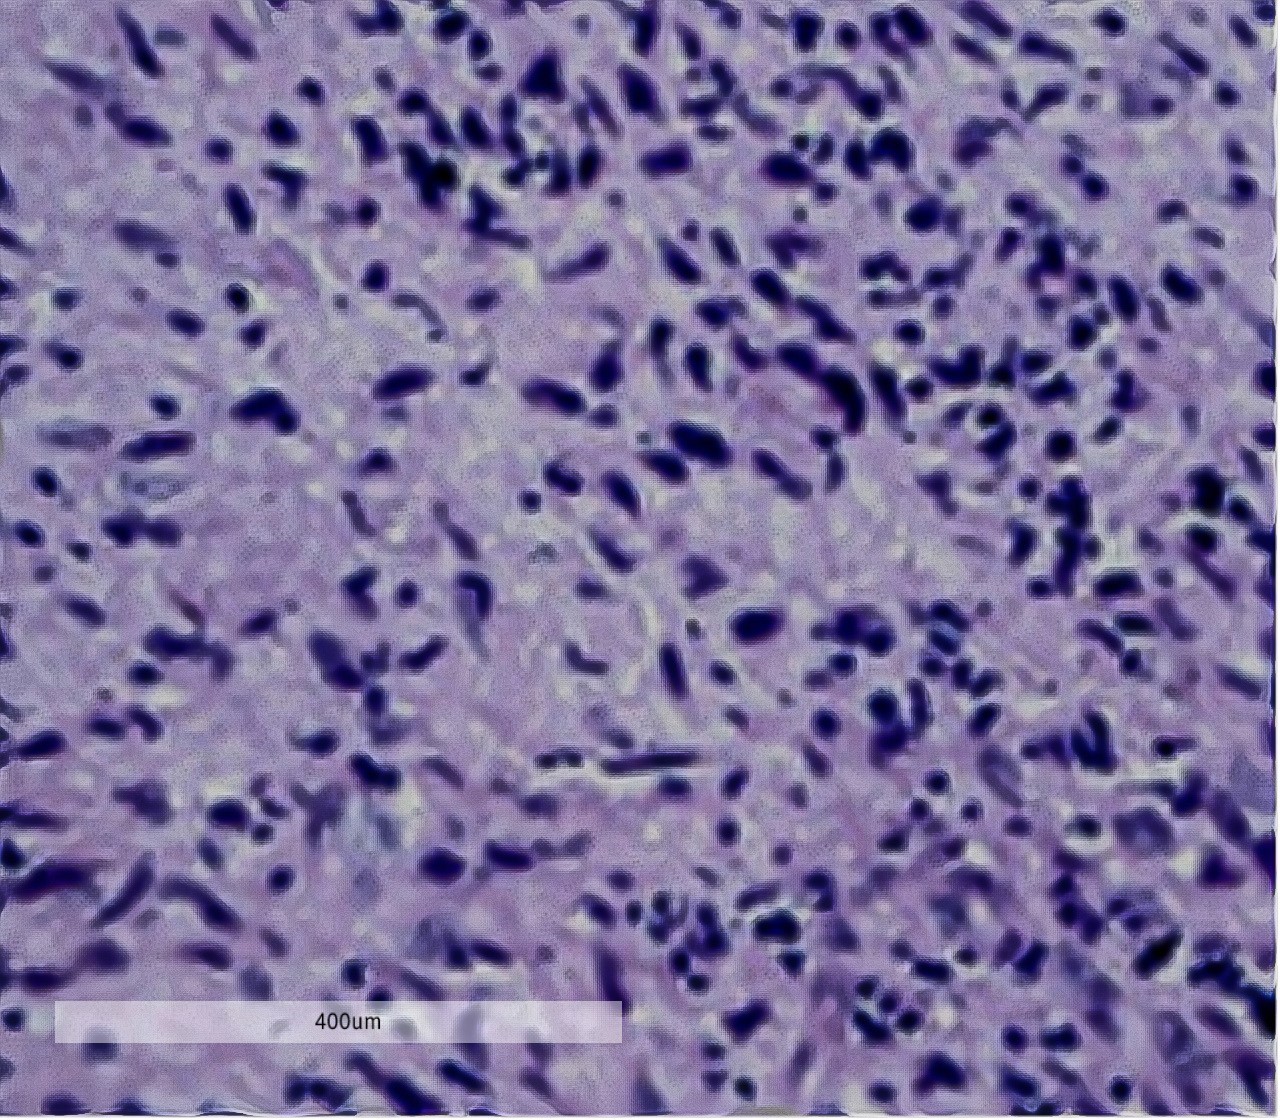
Fig. 2. Histology slices of moderately differentiated human EAC. А. The donor tumor. B. The orthotopic xenograft, passage 1. Hematoxylin-eosin staining; ×400
Fig. 3. TGW of the PDX model of human EAC in the experimental groups of mice irradiated with 4 Gy (group 1), 6 Gy (group 2), 8 Gy (group 3), and 10 Gy (group 4)
Fig. 4. Histology slices of the PDX model of human EAC generated in Balb/cNude mice after irradiation with a total dose of 30 Gy. Hematoxylin-eosin staining; ×400
Table 1. Mean EAC xenograft volumes and mouse body weight in the control and experimental groups
Note: * — differences are significant between groups 1 (4 Gy), 2 (6 Gy), 3 (8 Gy), 4 (10 Gy) and the control group; Mann–Whitney U test (p < 0.05); • — differences are significant between groups 1 (4 Gy), 2 (6 Gy), 3 (8 Gy), 4 (10 Gy) and the control group; Mann–Whitney U test (p ≤ 0,01).
Table 2. Complete blood counts on day 25 of the experiment
Note: * — differs from the control group, p < 0.01; the Wilcoxon rank sum test.
Table 3. Results of blood biochemistry tests on day 25 of the experiment
Note: * — differs from the control group, p < 0.01; the Mann–Whitney U test. ALT — alanine aminotransferase; ALP — alkaline phosphatase.