ORIGINAL RESEARCH

Brain connectivity changes in patients with working memory impairments with chronic ischemic cerebrovascular disease

About authors

Research Center of Neurology, Moscow, Russia

Correspondence should be addressed: Vitaly F. Fokin
Volokolamskoye shosse 80, Moscow, 125367; ur.liam@fvf

About paper

Funding: the study was ordered by the Research Center of Neurology (Federal Research Institution).

Author contribution: Fokin VF — data analysis, article authoring; Ponomareva NV — psychometric and neuroimaging data collection and analysis, participation in authoring the article; Konovalov RN — neuroimaging, processing of the results; Krotenkova MV — neuroimaging, analysis of the results; Medvedev RB — clinical examinations, analysis of the literature; Lagoda OV — analysis of the clinical data; Tanashyan MM — generalization of the clinical material in the context of the results obtained.
Received: 2019-08-19 Accepted: 2019-09-13 Published online: 2019-09-22
|
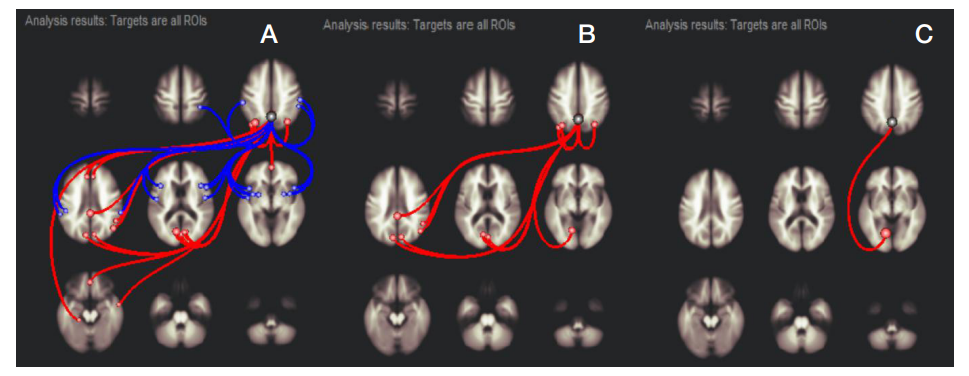
Fig. 1. Left frontal parahippocampal area connectivity to various brain structures; compromised WM group (A) and satisfactory WM group (B). C. Intergroup connectivity comparison (B–A). Red lines show positive correlation; blue lines show negative correlation. Blue lines in the Figure B indicate significant differences in patients with satisfactory WM compared to patients with compromised WM. Only statistically significant relationships are given, FDR-adjusted for multiple comparisons (p < 0.05)
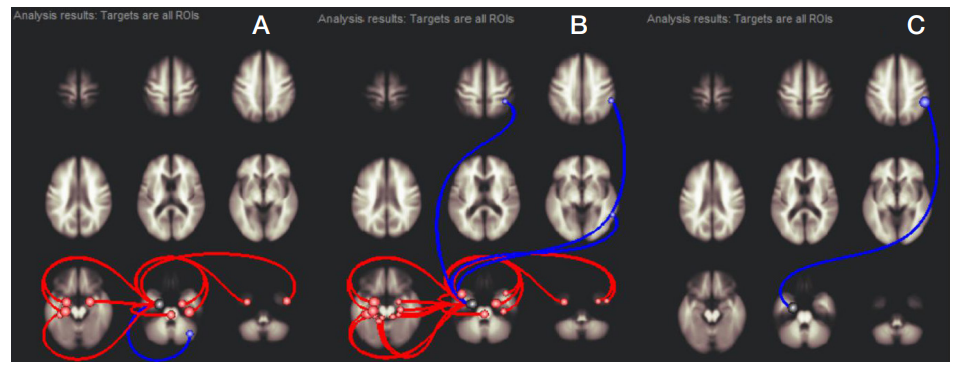
Fig. 2. Connectivity of segments 4 and 5 of the right cerebellum hemisphere to the various brain structures, compromised WM group and satisfactory WM group. Segments 4–5 belong to the frontal cerebellum. A. Compromised WM group. B. Satisfactory WM group. C. Difference in connectivity (B–A). 1, 2 — areas of interest are in the left frontoparietal network (FPN); 3 — middle frontal gyrus
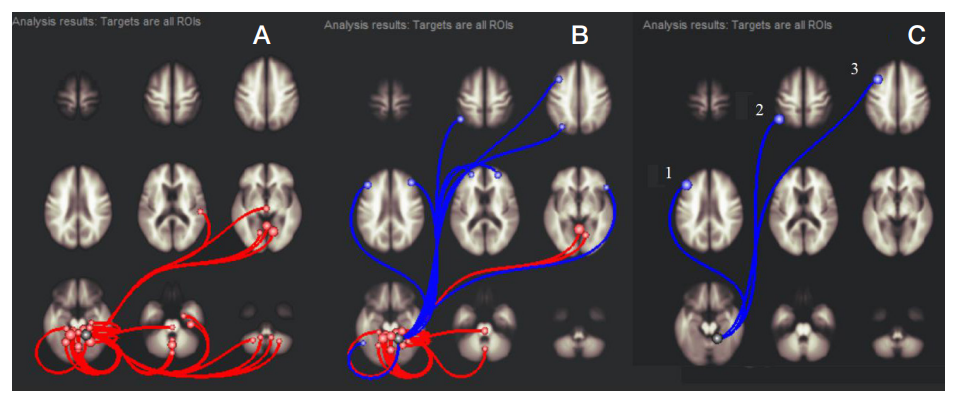
Fig. 3. Connectivity of the right cingulate gyrus posterior (part of DMN), compromised WM group and satisfactory WM group. (See Figures 1 and 2 for designations.) Intergroup differences in connectivity found between the right cingulate gyrus and the left lingual gyrus
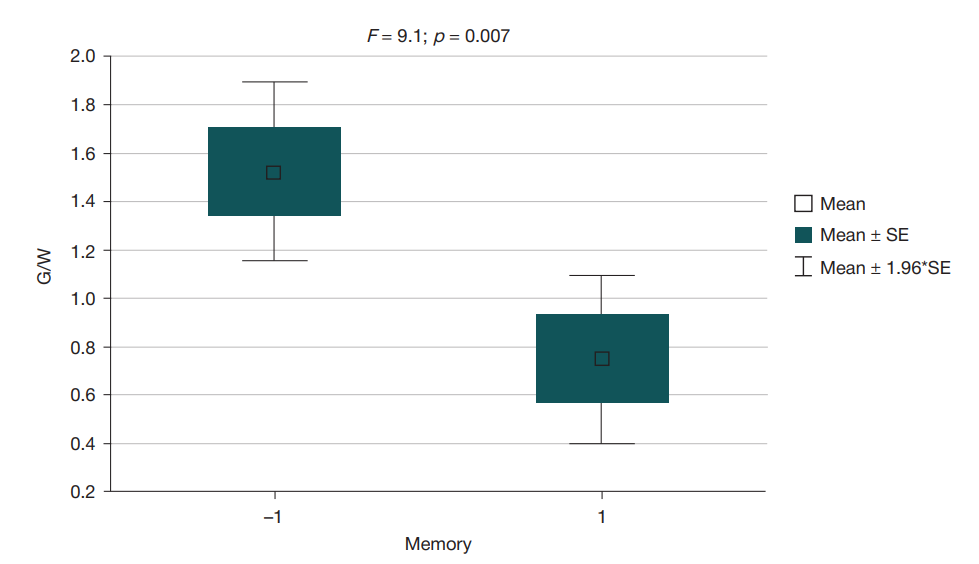
Fig. 4. WM and the relationship between the volume of gray and white matter (G/W). “–1” and “1” — compromised and satisfactory WM groups of CICD patients, respectively. Gray (G) to white (W) matter volume ratio (Y-axis). Statistical indicators of differences between groups: F — Fisher's test, p — level of significance (above)
Table. Statistical indicators of intergroup differences, satisfactory WM group and compromised WM group
Note: beta — standardized regression coefficient; FDR — false discovery rate; negative beta and T-test mean negative connectivity; L — left; R — right; FPN — frontoparietal network; MFG — middle frontal gyrus; PHA — parahippocampal area; SMG — supramarginal gyrus; DMN — default mode network; LG — lingual gyrus.