CLINICAL CASE

Moyamoya disease as a possible cause of ischemic stroke in adult patients

Vishnyakova AYu1, Rostovtseva TM1, Kovrazhkina EA1, Golovin DA1, Gubsky IL1, Lelyuk SE2, Lelyuk VG1
About authors

1 Federal Center of Brain Research and Neurotechnologies, Moscow, Russia

2 Russian Medical Academy of Continuous Professional Education, Moscow, Russia

Correspondence should be addressed: Anastasia Yu. Vishnyakova
Ostrovityanova 1, str. 10, Moscow, 117997; ur.xednay@uahsiv

About paper

Funding: the study was part of the State Assignment 056-00171-19-01. Topic ID: АААА-А19-119042590018-0 (March 29, 2019).

Author contribution: Vishnyakova AYu — literature analysis, imaging, data analysis and interpretation, manuscript preparation; Rostovtseva TM — imaging, data analysis and interpretation, figures; Kovrazhkina EA — clinical examination; Golovin DA — imaging; Gubsky IL — data analysis and interpretation; Lelyuk SE — manuscript editing; Lelyuk VG — study concept, manuscript editing.

Compliance with ethical standards: the study was approved by the Ethics Committee of FSBI Federal Center of Brain Research and Neurotechnologies of the Federal Medical Biological Agency (Protocol dated October 4, 2021). All patients gave informed consent to participate in the study.
Received: 2021-09-29 Accepted: 2021-10-13 Published online: 2021-10-31
|
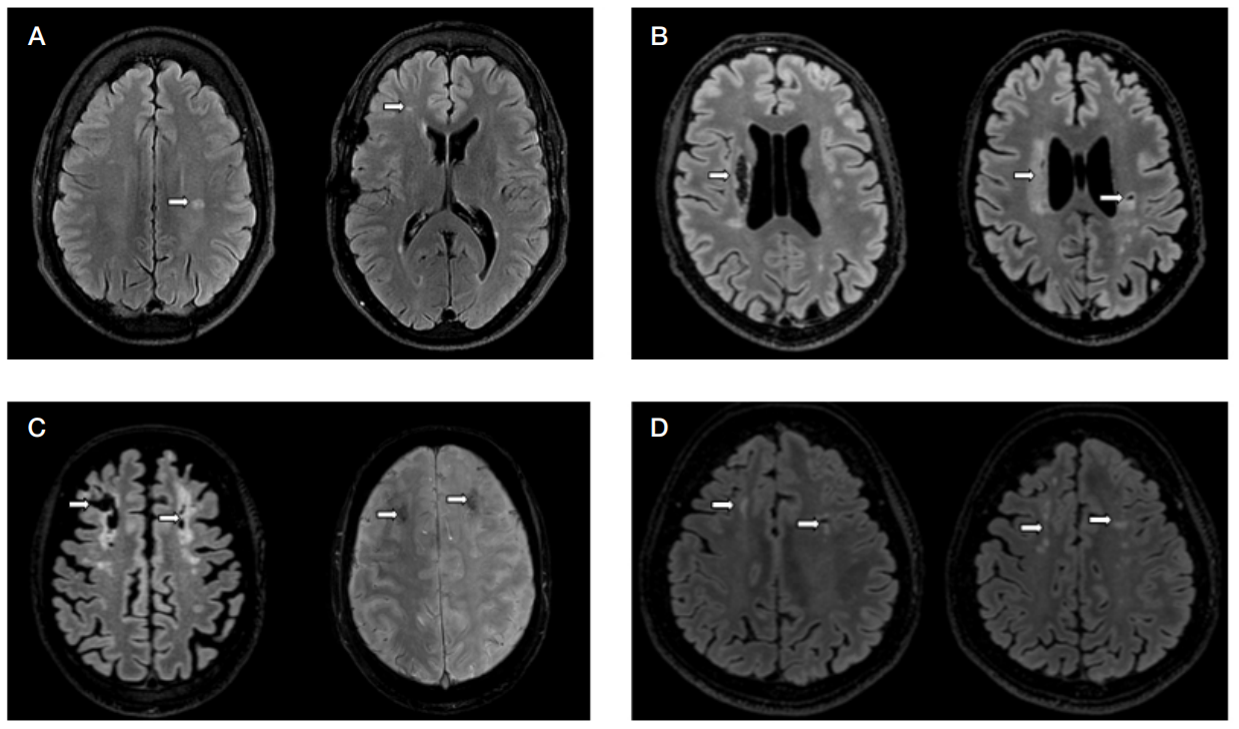
Fig. 1. MR images showing changes in the brain of adult patients with moyamoya disease after a cerebral infarction. A. Patient B (axial FLAIR): a small area of reactive changes in the left posterior frontal lobe white matter; small scanty areas of white matter gliosis in the right frontal lobe (the border zone between MCA and ACA) are indicated by arrows. B. Patient G (axial FLAIR): gliotic and cystic lesions in the putamen and the semioval center (the lateral lenticulostriate artery territory) in the right hemisphere; similar lesions in the left semioval center (the internal watershed area); the lesions are marked by arrows C. Patient Yu (left image: axial FLAIR; right image: axial SWI): hemorrhagic transformation (petechiae) after a past cerebral infarction (hemorrhage infarction type 1 according to ECASS II) in the frontal lobe white matter (the border zone between MCA and ACA) is indicated by arrows. D. Patient V (axial FLAIR): multiple areas of gliosis and a small lesion after a past lacunar stroke in the frontal lobe white matter (the border zone between MCA and ACA) are indicated by arrows.
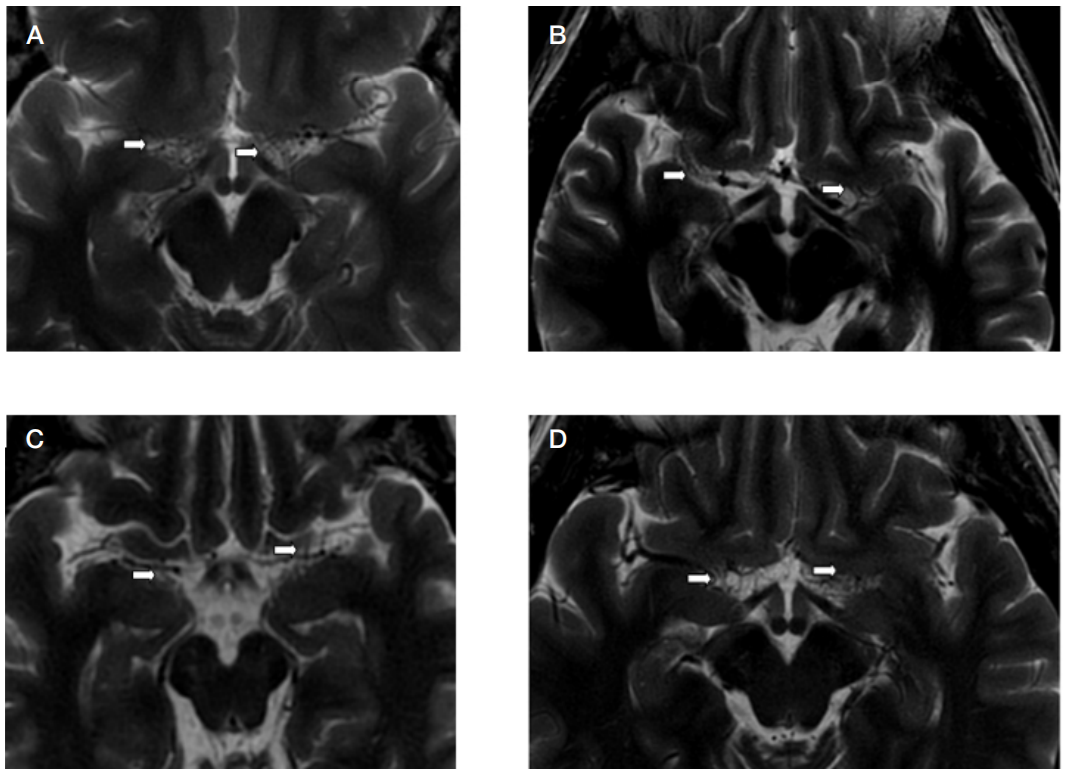
Fig. 2. MR images of the abnormal vascular network at the base of the brain of adult patients with moyamoya disease (axial T2 WI). Proximal parts of MCA segments are not visualized clearly; a network of small blood vessels indicated by arrows is visible in their projection. A. Patient B. B. Patient G. C. Patient Yu. D. Patient V
Fig. 3. 3D-TOF MR angiograms showing vascular changes in adult patients with moyamoya disease. A. Patient B: the absence of flow signal from distal ICA and MCA (arrows). Proximal parts of ACA are visible and stenotic. PCAs are intact. B. Patient G: significant luminal narrowing of distal ICA, the absence of flow signal from MCA (arrows). ACAs are intact. PCcoms and PCAs are slightly dilated. C. Patient Yu: the absence of flow signal from distal ICA and MCA and ACA (arrows). PCcoms and PCAs are intact. D. Patient V: the absence of flow signal from distal ICA and MCA and ACA. PCcoms and PCAs are dilated (arrows)
Fig. 4. Oblique coronal CT angiographic images of intracranial arteries showing vascular changes in the brain of adult patients with moyamoya disease. A. Patient B: distal segments of both ICAs and proximal parts of both MCAs are not visualized due to occlusion; a network of small anastomotic vessels is visible in their projection. The images show enhancement of lenticulostriate arteries in the basal ganglia area. Craniotomy marks are observed on temporal bones on both sides; circulation is visualized in extra- and intracranial anastomoses. B. Patient G: distal segments of both ICAs are stenotic, both MCA are occluded; a network of small anastomotic vessels is visualized in their projection. ACAs are visible along their course and have a normal diameter. C. Patient Yu: distal segments of both ICAs and proximal parts of both MCAs are occluded; a network of small anastomotic blood vessels is visualized in their projection. D. Patient V: distal segments of both ICAs and proximal parts of both MCAs are occluded, a network of small anastomotic blood vessels is visualized in their projection. Lenticulostriate arteries in the basal ganglia area are contrast-enhanced
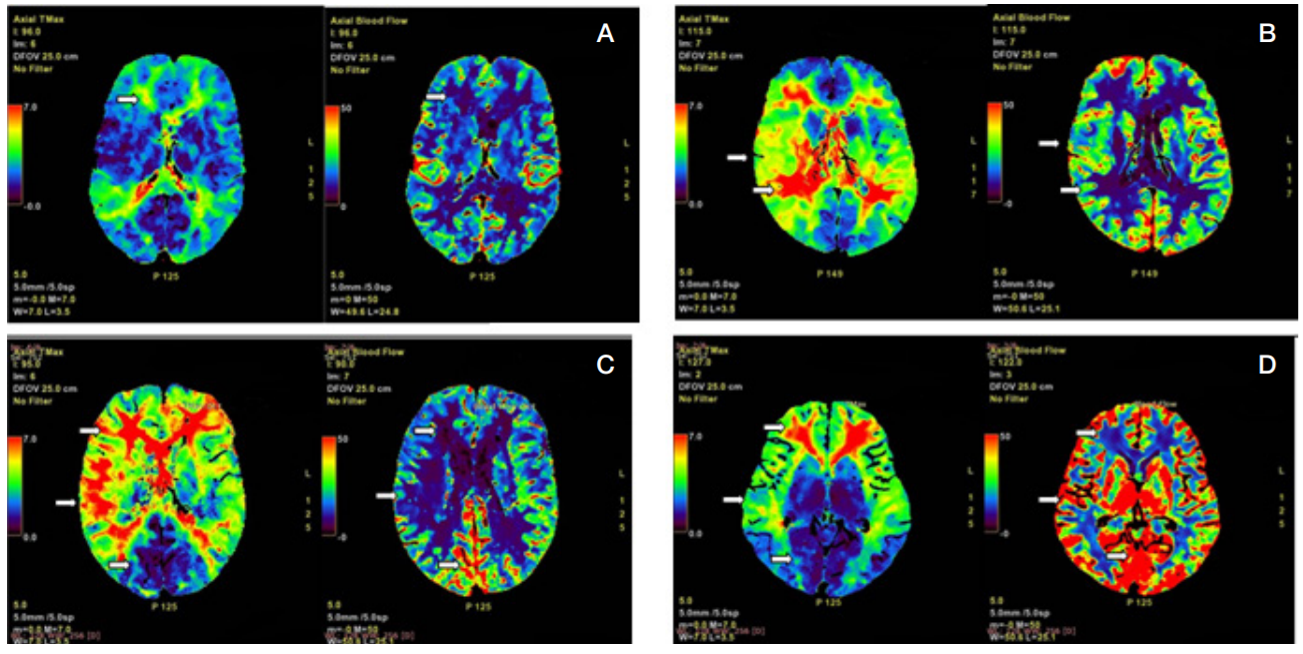
Fig. 5. CT perfusion imaging of the brain (axial planes). Perfusion maps for Tmax and CBF. A. Patient B: prolonged enhancement is observed in the border zones between MCA and ACA and between MCA and PCA (prolonged Tmax: 4–5 s), perfusion is moderately reduced (arrows). B. Patient G: critical hypoperfusion in the border zones between MCA and ACA and between MCA and PCA (Tmax > 6 s), moderate hypoperfusion in the MCA territory (Tmax ~ 5 s) (arrows). C. Patient Yu: critical hypoperfusion in the border zones between MCA and ACA and between MCA and PCA (Tmax > 6 s), hypoperfusion in the MCA and ACA territories (more pronounced on the right), hyperperfusion in the PCA territory (arrows). D. Patient V: critical hypoperfusion (Tmax > 6 s) in the border zones between MCA and ACA, moderate hypoperfusion in the territories of cortical MCA and ACA branches, hyperperfusion in the PCA territory (arrows)
Fig. 6. Transcranial duplex ultrasonography of the anterior circulation, color Doppler (AC), color Doppler combined with spectral Doppler (DG). A, D. Patient B: differently directed color flows in the projection of the М1 segment of MCA. ACAs cannot be located. B, E. Patient G: single flows are located to the projection of the proximal M1 segment of MCA (up to the stenotic segment). Normally directed flows are seen in the А1-segments of ACAs (arrows). C, F. Patient V: differently directed intertwining flows can be located to the projection of the M1 segment of MCA; the image shows the Doppler spectrum for the M2 segment of MCA upstream of the stenotic region (collateral type). ACAs cannot be located. G. Patient Yu: M1 segments of MCA and A1 segments of ACA cannot be located. The image shows the Doppler spectrum for the M2 segment of MCA upstream of the stenotic region (collateral type) H. Patient Yu: the Doppler spectrum for the left terminal ICA, the linear velocity of the blood flow is increased at the sample site, suggesting arterial stenosis. The same flow pattern is observed in the right terminal ICA. I. Patient V: the Doppler spectrum for the left terminal ICA, increased linear velocity at the sample site, suggesting arterial stenosis. The same flow pattern is observed in the right terminal ICA
Fig. 7. Transcranial duplex ultrasonography of PCcom and PCA (color Doppler and spectral Doppler). A. Patient V: color Doppler for PCcom, PCA (segments Р2-Р3) and its branches. The pattern may suggest increased blood flow in these arteries. B. Patient G: high-velocity blood flow in PCcom. C. Patient Yu: high-velocity blood flow in the temporal branch of PCA