ORIGINAL RESEARCH

Cerebral neural networks in cases of concomitant chronic cerebral ischemia and type 2 diabetes mellitus

About authors

Research Center of Neurology, Moscow, Russia

Correspondence should be addressed: Vitaly Fedorovich Fokin
Volokolamskoye shosse, 80, Moscow, 125367, Russia; ur.liam@fvf

About paper

Funding: the study was supported through the grant by RSF 22-15-00448.

Author contribution: Fokin VF — article authoring; Ponomareva NV — design of physiological and neuropsychological tests, general design of the study; Konovalov RN — design of neuroimaging evaluation; Shabalina AA — biochemical tests; Medvedev RB — dopplerogaphy; Lagoda OV — clinical tests; Boravova AI — psychophysiological tests; Krotenkova MV — management of neuroimaging evaluation; Tanashyan MM — management of clinical tests, general design of the study.

Compliance with ethical standards: the study was approved by the local Ethical Committee of the Research Center of Neurology (Minutes #5-6/22 of June 1, 2022). All participants submitted signed informed consent forms.
Received: 2023-09-14 Accepted: 2023-09-22 Published online: 2023-10-31
|
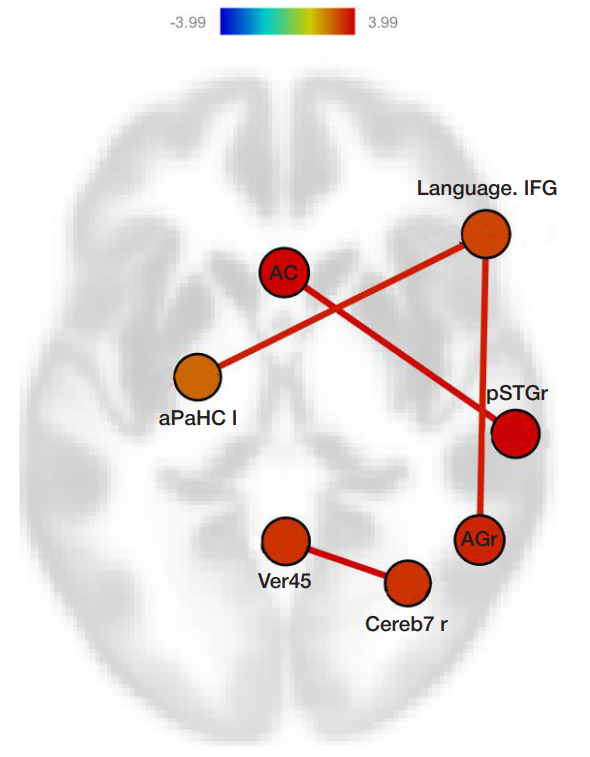
Fig. 1. Statistically significant prevalence of positive connectivities in group 1 (CCI patients without DM2) compared to group 2 (CCI patients with DM2). Distribution of connectivities by brain regions. At the top — T-test color scale. Legend: Cereb — Cerebellum; Ver — Vermis; Language — speech neural network; IFG — Inferior Frontal Gyrus; AC — Cingulate Gyrus, anterior division; pSTG r — Superior Temporal Gyrus, posterior division, right hemisphere; aPAHC l — Parahippocampal Gyrus, anterior division, left hemisphere; AG r — Angular Gyrus, right hemisphere. The numbers after Cereb and Ver are regions of the cerebellum and the vermis.
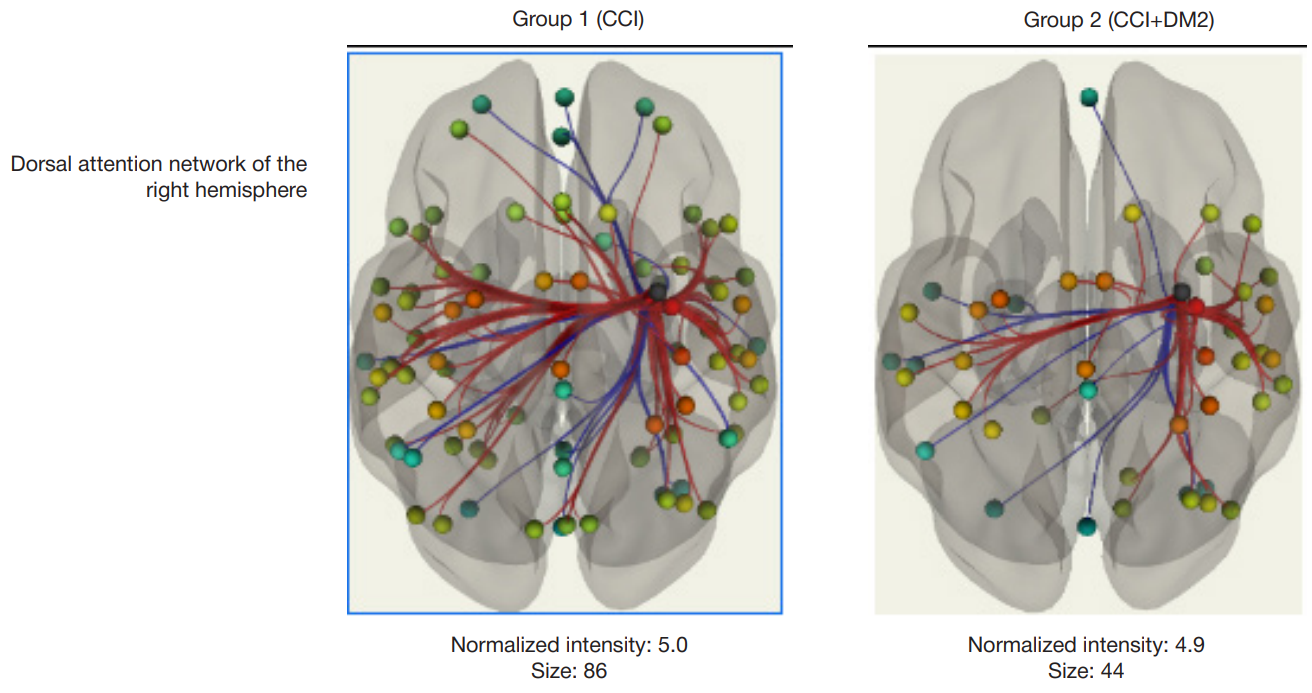
Fig. 2. presents distribution of connectivities coming out of the dorsal attention network in the right hemisphere.
Table 1. Demographic characteristics of CCI patients with DM2 and without DM2
Note: the table shows mean values ± standard errors.
Table 2. Biochemical, psychometric, and hemodynamic indicators significantly different in the two groups of CCI patients (with and without DM2), as revealed by ANOVA, as well as means and standard errors of the indicators
Note: n — number of subjects, F — Fisher's test, p — level of significance, MCA — middle cerebral artery, LP — letter patterns, K — proof-reading test success rate.
Table 3. Neural networks' connectivity differences prevailing in group 1 compared to group 2
Note: legend for Figure 1 applies; T-test is a two-tailed sided Student's T-test, numbers in parentheses — number of degrees of freedom; p(unadjusted) — level of significance unadjusted for FDR; p(FDR) — level of significance adjusted for false discovery rate.
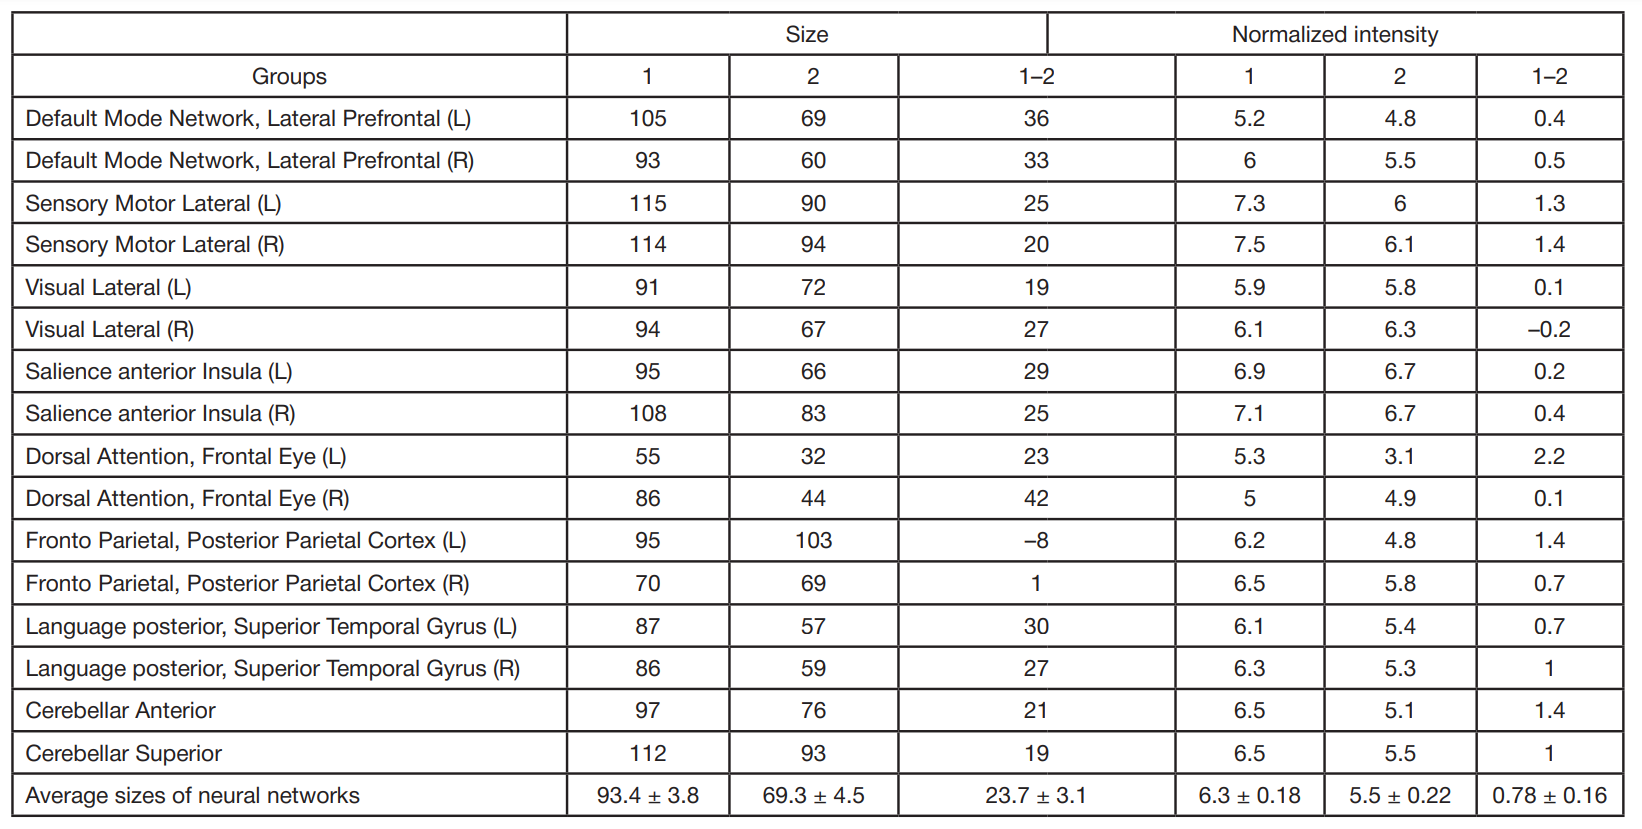
Table 4. Quantity of cerebral neural networks' connectivities (size) and their normalized intensity, based on fMRI data, group 1 (CCI without DM2) and group 2 (CCI with DM2)
Note: (L) — left hemisphere, (R) — right hemisphere; 1 and 2 — group 1 (without DM2) and group 2 (with DM2); 1–2 — difference between the parameters' values registered in the groups.