Copyright: © 2025 by the authors. Licensee: Pirogov University.
This article is an open access article distributed under the terms and conditions of the Creative Commons Attribution license (CC BY).

ORIGINAL RESEARCH

Morphological subchondral bone tissue characteristics in knee osteoarthritis

Minasov BSh1, Yakupov RR1, Akbashev VN1, Shchekin VS1, Vlasova AO1, Minasov TB1, Karimov KK2, Akhmeldinova AA1
About authors

1 Bashkir State Medical University, Ufa, Russia

2 Avicenna Tajik State Medical University, Dushanbe, Tajikistan

Correspondence should be addressed: Vladislav N. Akbashev
Lenina, 3, Ufa, 450008, Russia; ur.liam@bka-dalv

About paper

Author contribution: Minasov BSh — study concept and design, data analysis and interpretation, manuscript editing; Yakupov RR — material collection, morphological assessment, primary data processing; Akbashev VN — statistical processing, visualization of results, manuscript writing; Shchekin VS — literature review, morphology data interpretation; Vlasova AO — preparing illustrations, morphometry analysis, manuscript proofreading; Minasov TB — preparing illustrations, discussion; Karimov KK — material collection, clinical follow-up of patients; Akhmeldinova AA — drawing up inclusion/exclusion criteria, coordination of ethical approval.

Compliance with ethical standards: the study was approved by the Ethics Committee of the Bashkir State Medical University (protocol No. 3 dated 12 March 2025) and conducted in accordance with the World Medical Association Declaration of Helsinki (2013 revision). All patients submitted the informed consent to participation in the study.
Received: 2025-04-06 Accepted: 2025-04-20 Published online: 2025-04-30
|
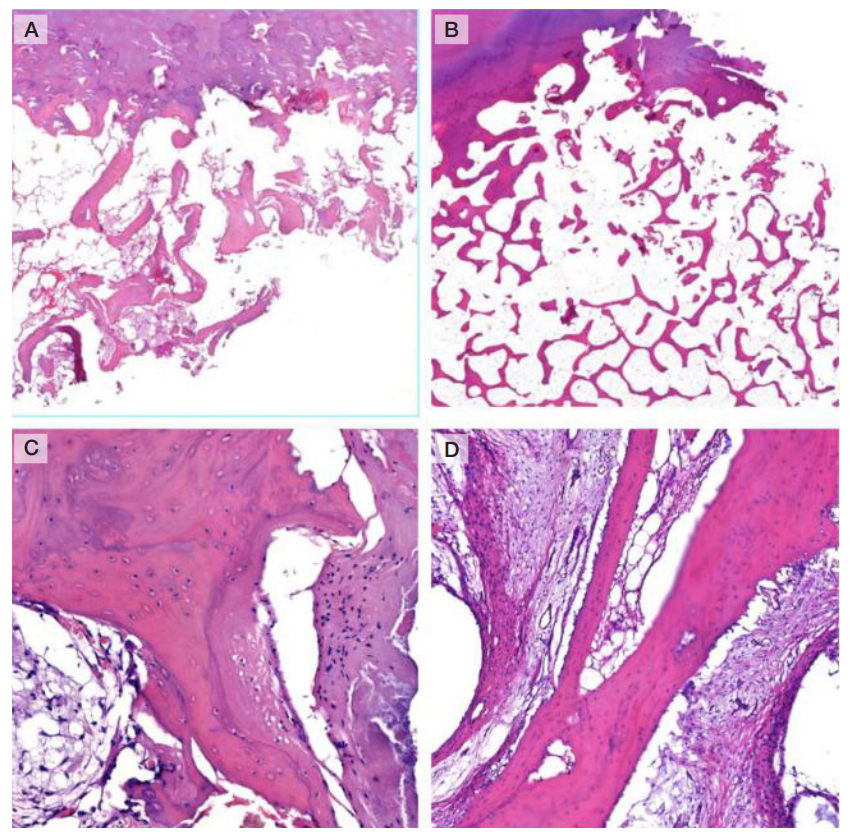
Fig. 1. Morphological alterations in the areas of subchondral bone sclerosis in osteoarthritis. Histological slides stained with hematoxylin and eosin; 20× (A, B), 200× (C, D) magnification. A. Fragment of the femoral subchondral zone: thickened trabeculae, anastomosing trabecular structure, narrowed intertrabecular spaces. B. Fragment of the tibia: huge osteosclerotic trabeculae, chaotic arrangement, reduced number of haversian canals, intratrabecular space partially replaced with fibrous tissue. C. Paratrabecular zone showing signs of sclerotic rearrangement: disorganized lamellar structure, foci of replacement with connective tissue. D. Bone marrow space: diffuse replacement with fibrous tissue with predominance of collagen fibers, trabeculae with reduced osteocytic lacunae
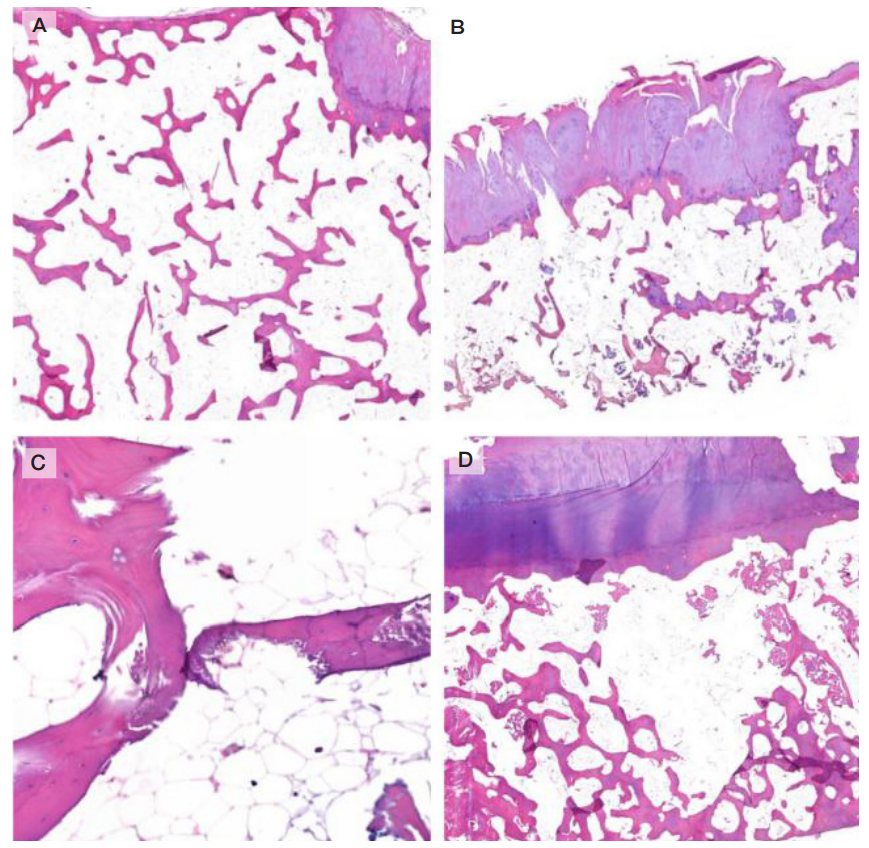
Fig. 2. Morphological characteristics of subchondral bone loss areas in osteoarthritis. Histological slides stained with hematoxylin and eosin; 20× (A, B), 200× (C, D) magnification. A. Subchondral zone of the femur: thinned trabeculae, dilated intertrabecular spaces, sporadic microcracks. B. Fragment of the tibia: disorganized trabecular structure, sparse architecture, disrupted trabeculae. C. Paratrabecular zone of the femur: clearly visible intertrabecular spaces filled with bone marrow fat, trabeculae showing signs of thinning. D. Bone marrow space of the tibia: areas of fibrous transformation, linear defects within the trabeculae
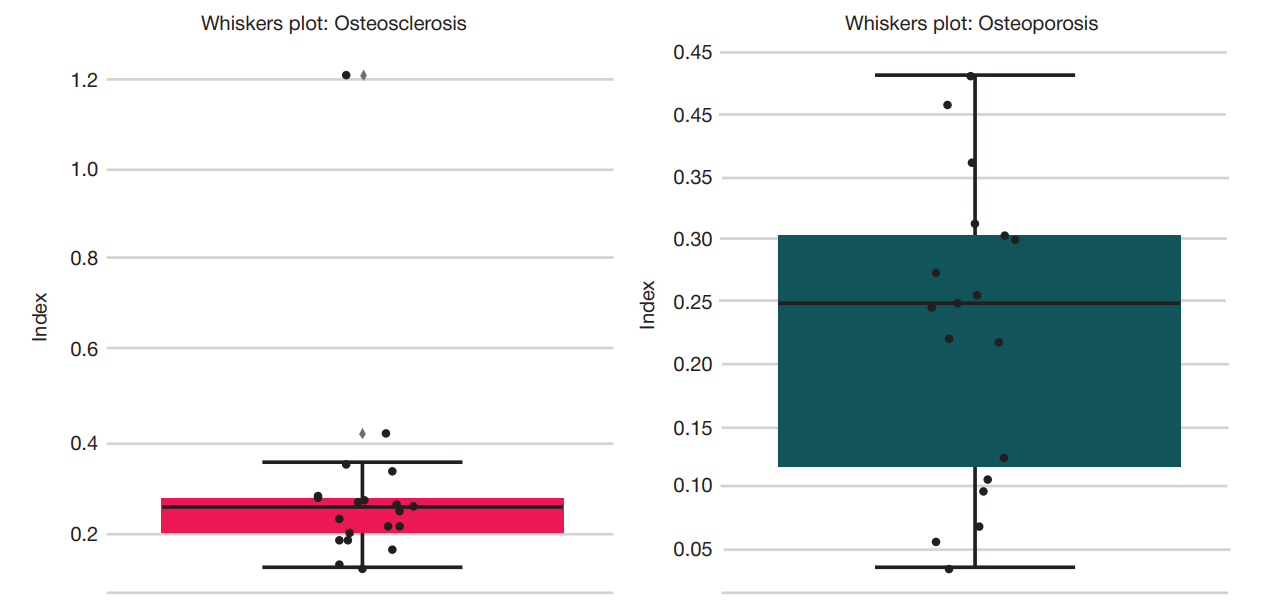
Fig. 3. Distribution of indices in the bone sclerosis and loss areas. The median values and interquartile range are provided. The analysis includes 40 fragments (2 per patient; n = 20) collected from the internal and external condyles of the femur and tibia. Areas of osteoporosis are characterized by significantly higher MFI values compared to the areas of sclerosis (p ≤ 0.05)
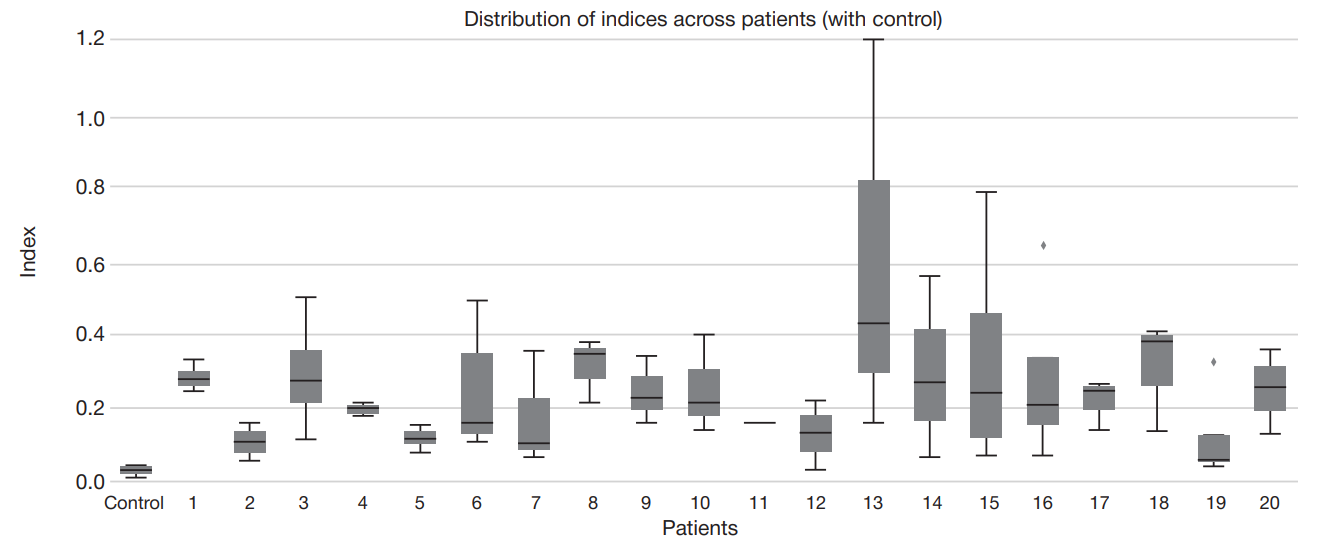
Fig. 4. Bone tissue microfracture index (MFI) in patients with osteoarthritis (based on the data on the areas of osteosclerosis and osteoporosis in the femur and tibia) compared to the literature data [13]. Aggregate MFI values are reported for each patient (n = 20), including two areas (of compaction and loss). The literature data are provided for tentative comparison, these have not been used as a control group
Table 1. Subchondral bone morphometric parameters in the studied groups (Me (25–75%))
Note: the values are presented as the median (25th–75th percentiles). Significance of differences between groups is assessed using the Mann–Whitney U test. The differences are considered significant at p < 0.05.
Table 2. Microfracture index (MFI)