Copyright: © 2025 by the authors. Licensee: Pirogov University.
This article is an open access article distributed under the terms and conditions of the Creative Commons Attribution license (CC BY).

ORIGINAL RESEARCH

Individual features of the masticatory muscle bioelectrical activity in organization of chewing function

Shishelova AYu1,2, Guseva OYu1, Kopetskiy IS1, Ansari V1
About authors

1 Pirogov Russian National Research Medical University (Pirogov University), Moscow, Russia

2 Institute of Higher Nervous Activity and Neurophysiology of the Russian Academy of Sciences, Moscow, Russia

Correspondence should be addressed: Olga Yu. Guseva
Ostrovityanova, 1, 117513, Moscow, Russia; ur.kb@avesug-o

About paper

Acknowledgements: we would like to thank Professor I.V. Pogabalo for advice on the methods to record and analyze electromyography data.

Author contribution: Shishelova AYu — study idea, concept and design, data acquisition and processing, statistical data processing, manuscript writing and editing; Guseva OYu — study concept and design, data acquisition and processing, literature review, manuscript writing and editing; Kopetskiy IS — manuscript editing and approval before publishing; Ansari V — data acquisition, literature review.

Compliance with ethical standards: the study was approved by the Ethics Committee of the Pirogov Russian National Research Medical University (protocol No. 250 dated 21 April 2025).
Received: 2025-05-19 Accepted: 2025-06-09 Published online: 2025-06-19
|
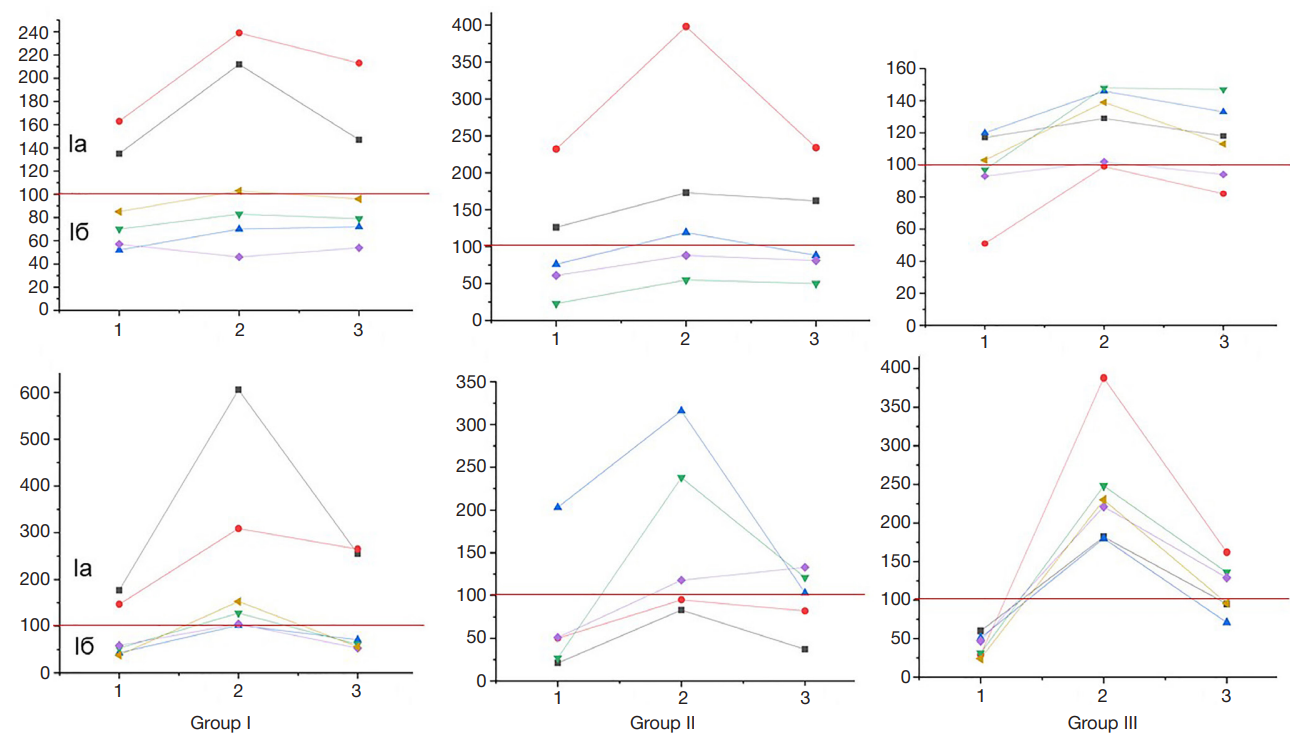
Fig. 1. Individual dynamics of the integrated AMG asymmetry index (AIint) in the identified groups. The x-axis represents the ordinal numbers of the chewing test (see Methods), and the y-axis represents AIint values (%). The upper row represents AIint of the temporal muscles, the lower row represents AIint of the masseter muscles. Each line shows individual AIint dynamics in a volunteer
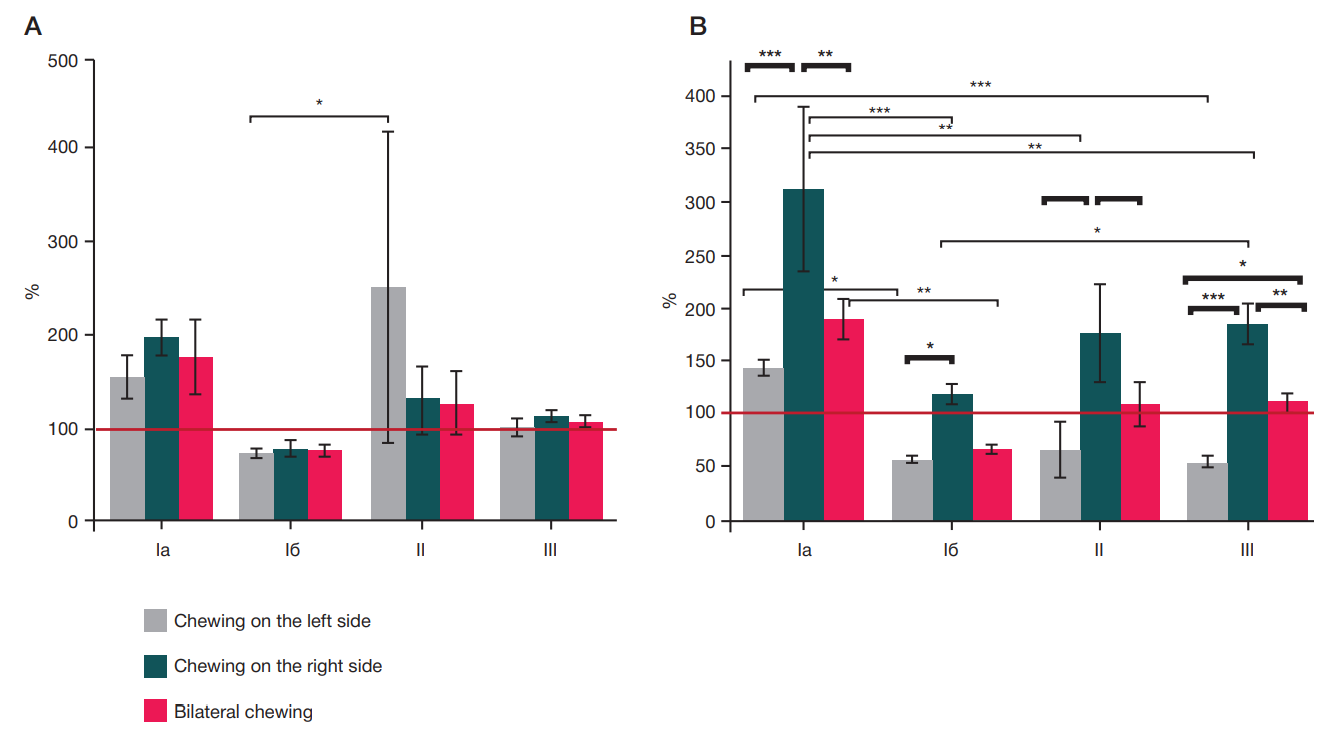
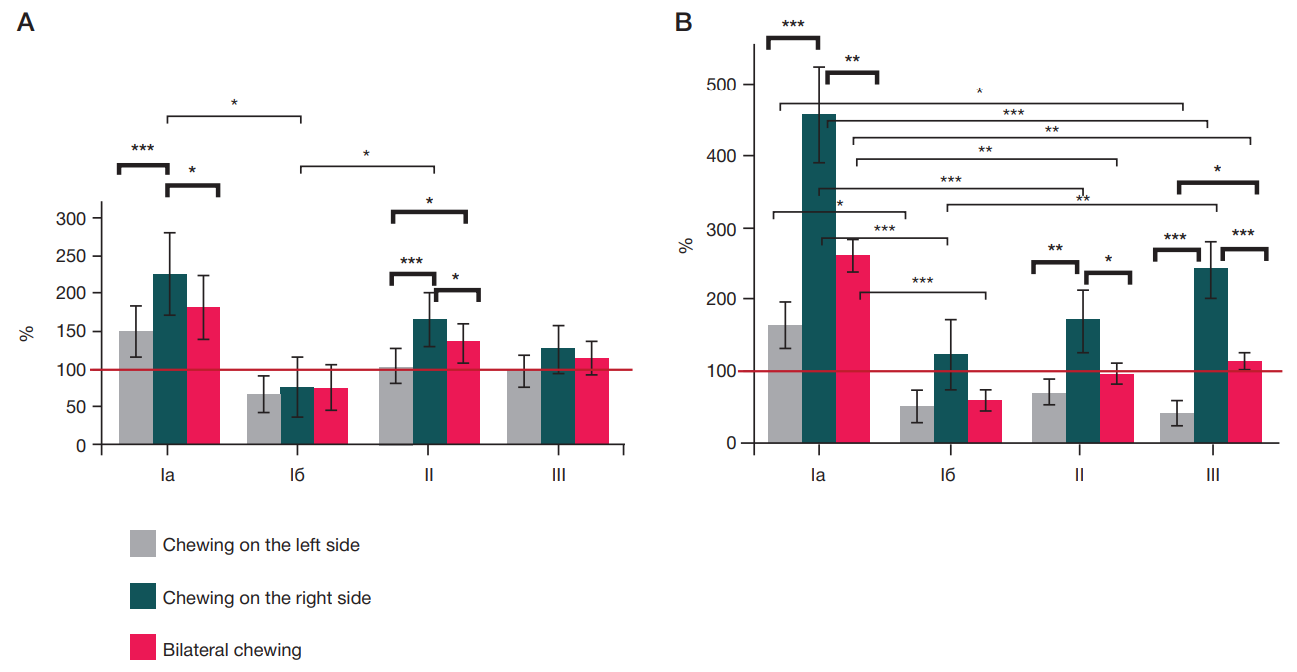
Fig. 2. The integrated EMG asymmetry index (AIint, %) in the chewing tests in the identified groups of volunteers. For each muscle, the bars represent intra-group mean AIint, the whiskers represent the SEM. The red line indicates the equal EMG activity of symmetrical muscles (AIint = 100%). А. Temporal muscles. B. Masseter muscles. Group designations: see text. Significant differences are indicated by square brackets above the bars (repeated measures ANOVA, Fisher’s post-hoc test): within-group differences between the chewing tests are highlighted in bold, between-group differences reported during a similar chewing test are highlighted in the light font as follows: * — p < 0.05; * * — p < 0.01; * * * — p < 0.001
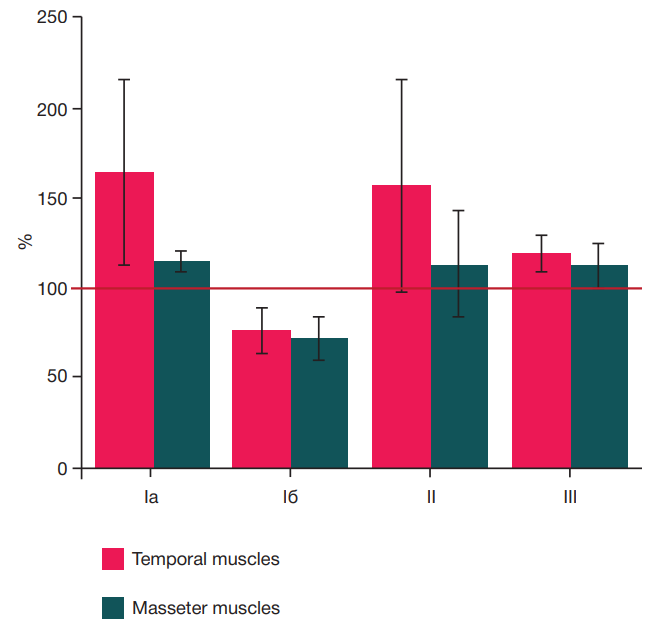
Fig. 3. The integrated EMG asymmetry index in the chewing test with maximum bite force (AImbf, %) in the identified groups of volunteers. For each muscle, the bars represent intra-group mean AImbf, the whiskers represent the SEM. The red line indicates the equal EMG activity of symmetrical muscles (AImbf = 100%). Group designations: see text
Fig. 4. The asymmetry index of the average EMG amplitude (AIav, %) in the chewing tests in the identified groups of volunteers. For each muscle, the bars represent intra-group mean AIav, the whiskers represent the SEM. The red line indicates the equal EMG activity of symmetrical muscles (AIav = 100%). А. Temporal muscles. B. Masseter muscles. Group designations: see text. Significant differences are indicated by square brackets above the bars (repeated measures ANOVA, Fisher’s post-hoc test): within-group differences between the chewing tests are highlighted in bold, between-group differences reported during a similar chewing test are highlighted in the light font as follows: * p < 0.05; * * p < 0.01; * * * p < 0.001
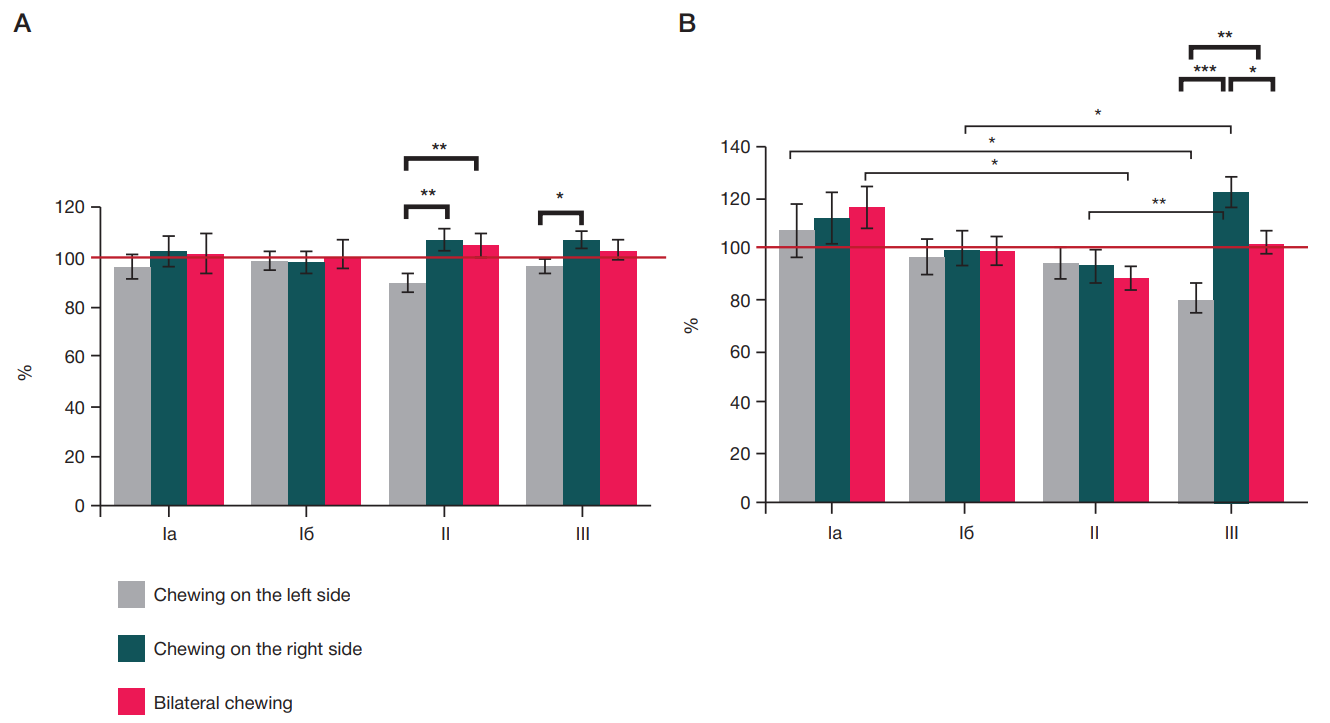
Fig. 5. The asymmetry index of the total chewing bursts duration in EMG (Aid, %) in the chewing tests in the identified groups of volunteers. For each muscle, the bars represent intra-group mean AId, the whiskers represent the SEM. The red line indicates the equal EMG activity of symmetrical muscles (AId = 100%). А. Temporal muscles. B. Masseter muscles. Group designations: see text. Significant differences are indicated by square brackets above the bars (repeated measures ANOVA, Fisher’s post-hoc test): within-group differences between the chewing tests are highlighted in bold, between-group differences reported during a similar chewing test are highlighted in the light font as follows: * p < 0.05; * * p < 0.01; * * * p < 0.001
Table. Percentage of subjects (%) with dominant movement of the right limbs in the identified groups