Copyright: © 2025 by the authors. Licensee: Pirogov University.
This article is an open access article distributed under the terms and conditions of the Creative Commons Attribution license (CC BY).

ORIGINAL RESEARCH

Relationship of stable combinations of salivary catecholamines with cerebral function organization in patients with chronic cerebral ischemia

About authors

Research Center of Neurology, Moscow, Russia

Correspondence should be addressed: Vitaly F. Fokin
Volokolamskoye shosse 80, Moscow, 125367, Russia; ur.liam@fvf

About paper

Author contribution: Fokin VF — manuscript writing; Abaimov DA — biochemistry testing; Ponomareva NV — physiological and neuropsychological testing design, general study design; Medvedev RB — Doppler tests and clinical assessment; Konovalov RN — brain imaging testing design; Lagoda OV — clinical assessment; Krotenkova MV — brain imaging testing management; Shabalina AA — biochemistry testing design; Tanashyan MM — clinical assessment management, general study design.

Compliance with ethical standards: the study was approved by the Ethics Committee of the Research Center of Neurology (protocol No. 5-6/22 dated 1 June 2022). The informed consent was submitted by all study participants.
Received: 2025-07-29 Accepted: 2025-08-13 Published online: 2025-08-21
|
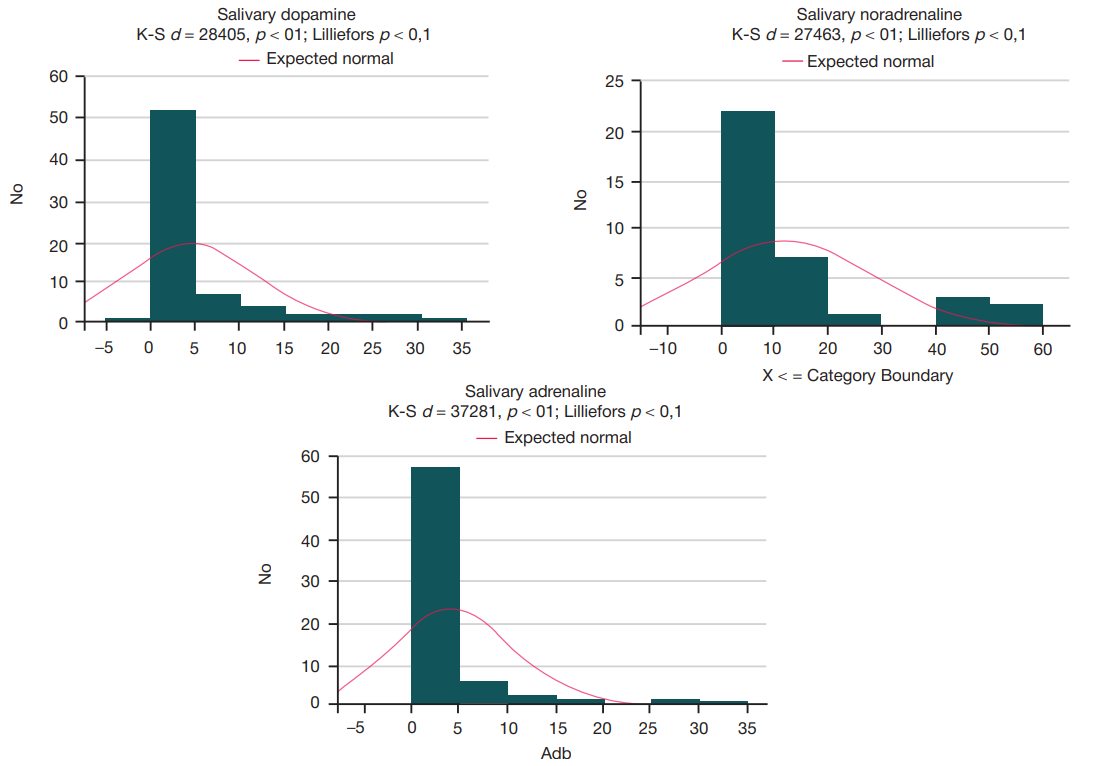
Fig. 1. Bar charts of salivary dopamine, norepinephrine, and adrenaline distribution (ng/mL). Vertical axis (Y) — number of subjects; horizontal axis (X) — catecholamine concentration (ng/mL). K-S — Kolmogorov–Smirnov test, Liliefors — Lilliefors test
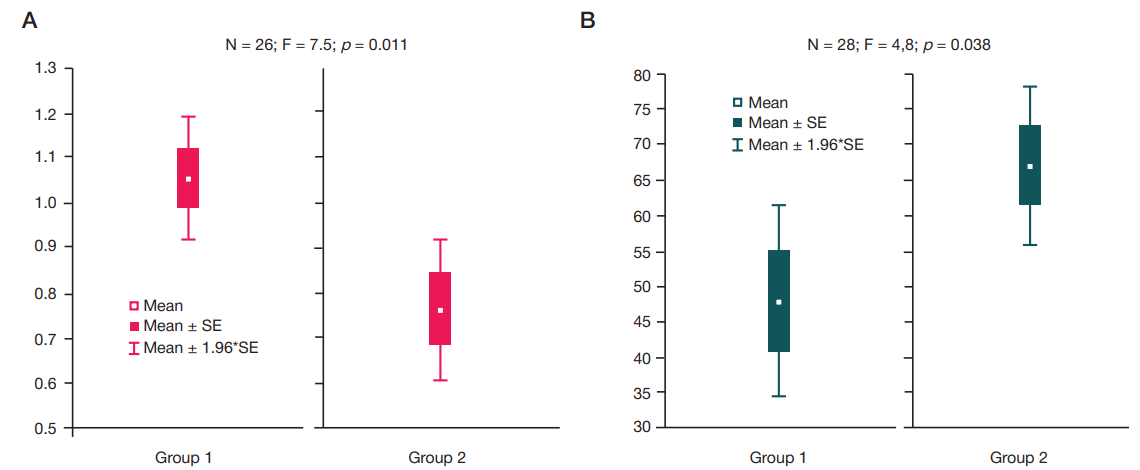
Fig. 2. Differences in memory characteristics (А) and salivary cortisol levels (B) in two groups with different CA values. N — number of subjects; F — F-test; p — significance level. А. The vertical axis shows delayed word recall relative to the average level of direct recall of 10 words (Luria’s test). B. The vertical axis shows salivary cortisol levels (nmol/L)
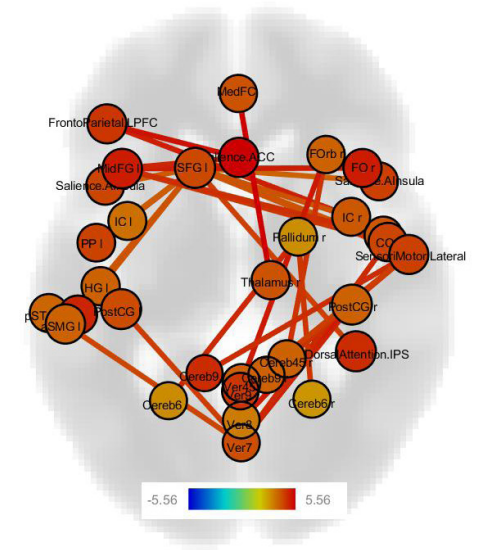
Fig. 3. Connectivity difference with the more low and high levels of all catecholamines (group 1 — group 2), pFDR < 0.02. There is a Student’s t-test color chart below the figure. r, l — right and left hemispheres; Ver — Vermis, Cereb — cerebellum; digits following Ver, Cereb — share of the vermis or cerebellum; AC — Cingulate Gyrus anterior part; ACC — Anterior Cingulate Cortex; Cuneal — Cuneal Cortex; CO — Center Operculum Cortex; Forb — Frontal Orbital Cortex; HG — Heschl’s Gyrus; IC — Insular Cortex; sLOC — Lateral Occipital Cortex superior division; MedFC — Frontal Medial Cortex; PC — Cingulate Gyrus posterior division; aPaHC — Parahippocampal Gyrus anterior division; PaCiG — Paracingulate Gyrus; PostCG — Postcentral Gyrus; PreCG — Precentral Gyrus; PP — Planum Polare; SMA — Juxtapositional Lobule; SFG — Superior Frontal Gyrus; aSMG — aSTG — Superior Temporal Gyrus anterior division; toITG — Inferior Temporal Gyrus temperooccipital division; toMTG — Middle Temporal Gyrus temporooccipital part
Table. Spearman’s rank correlation (R)
Note: NA — norepinephrine; ADR — adrenaline; DA — dopamine; R — Spearman’s rank correlation coefficient; t — Student’s t-test; p — significance level.