Fig. 1. Stillbirth rate in Bryansk Region, boys, 1995 to 2015 (per 1,000 births, %)
Fig. 2. Stillbirth rate in Bryansk Region, girls, 1995 to 2015 (per 1,000 births, %)
Fig. 3. Stillbirth rate in Bryansk Region, boys and girls, 1995 to 2015 (per 1,000 births, %)
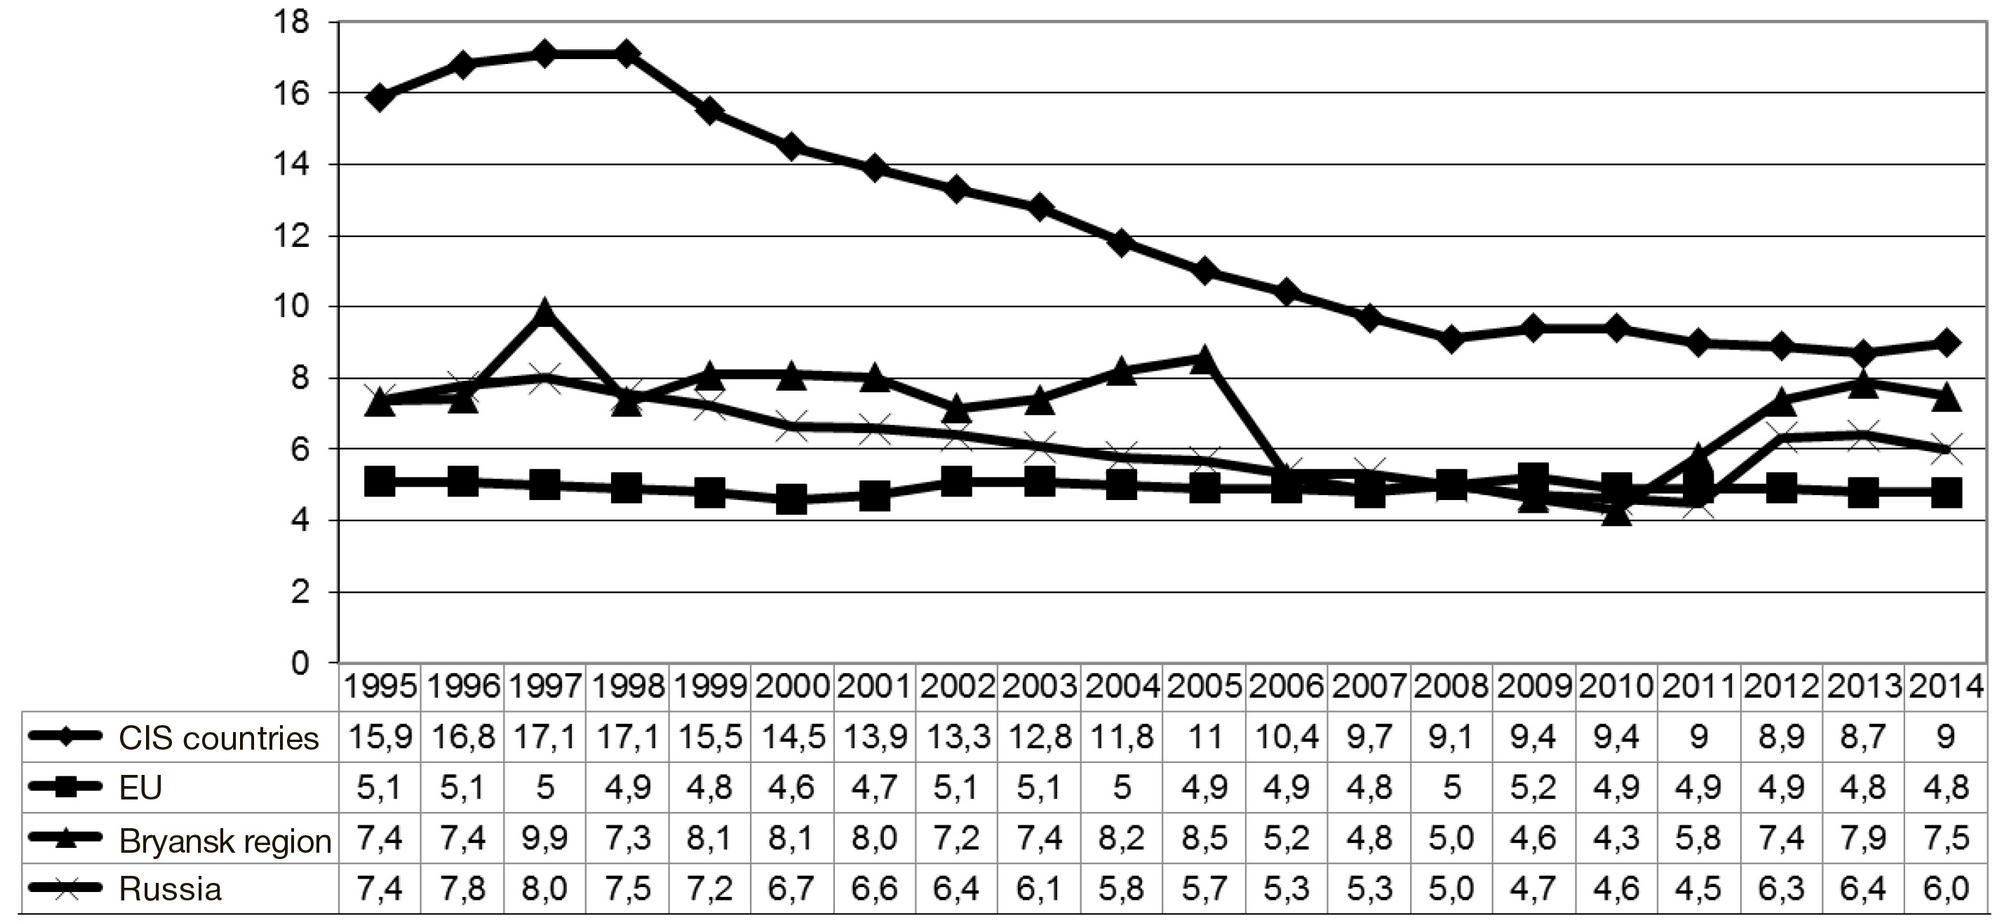
Fig. 4. Stillbirth rate, dynamics, boys and girls combined, Bryansk region, Russian Federation, EU and CIS countries, 1995 to 2015 (per 1,000 births, %)
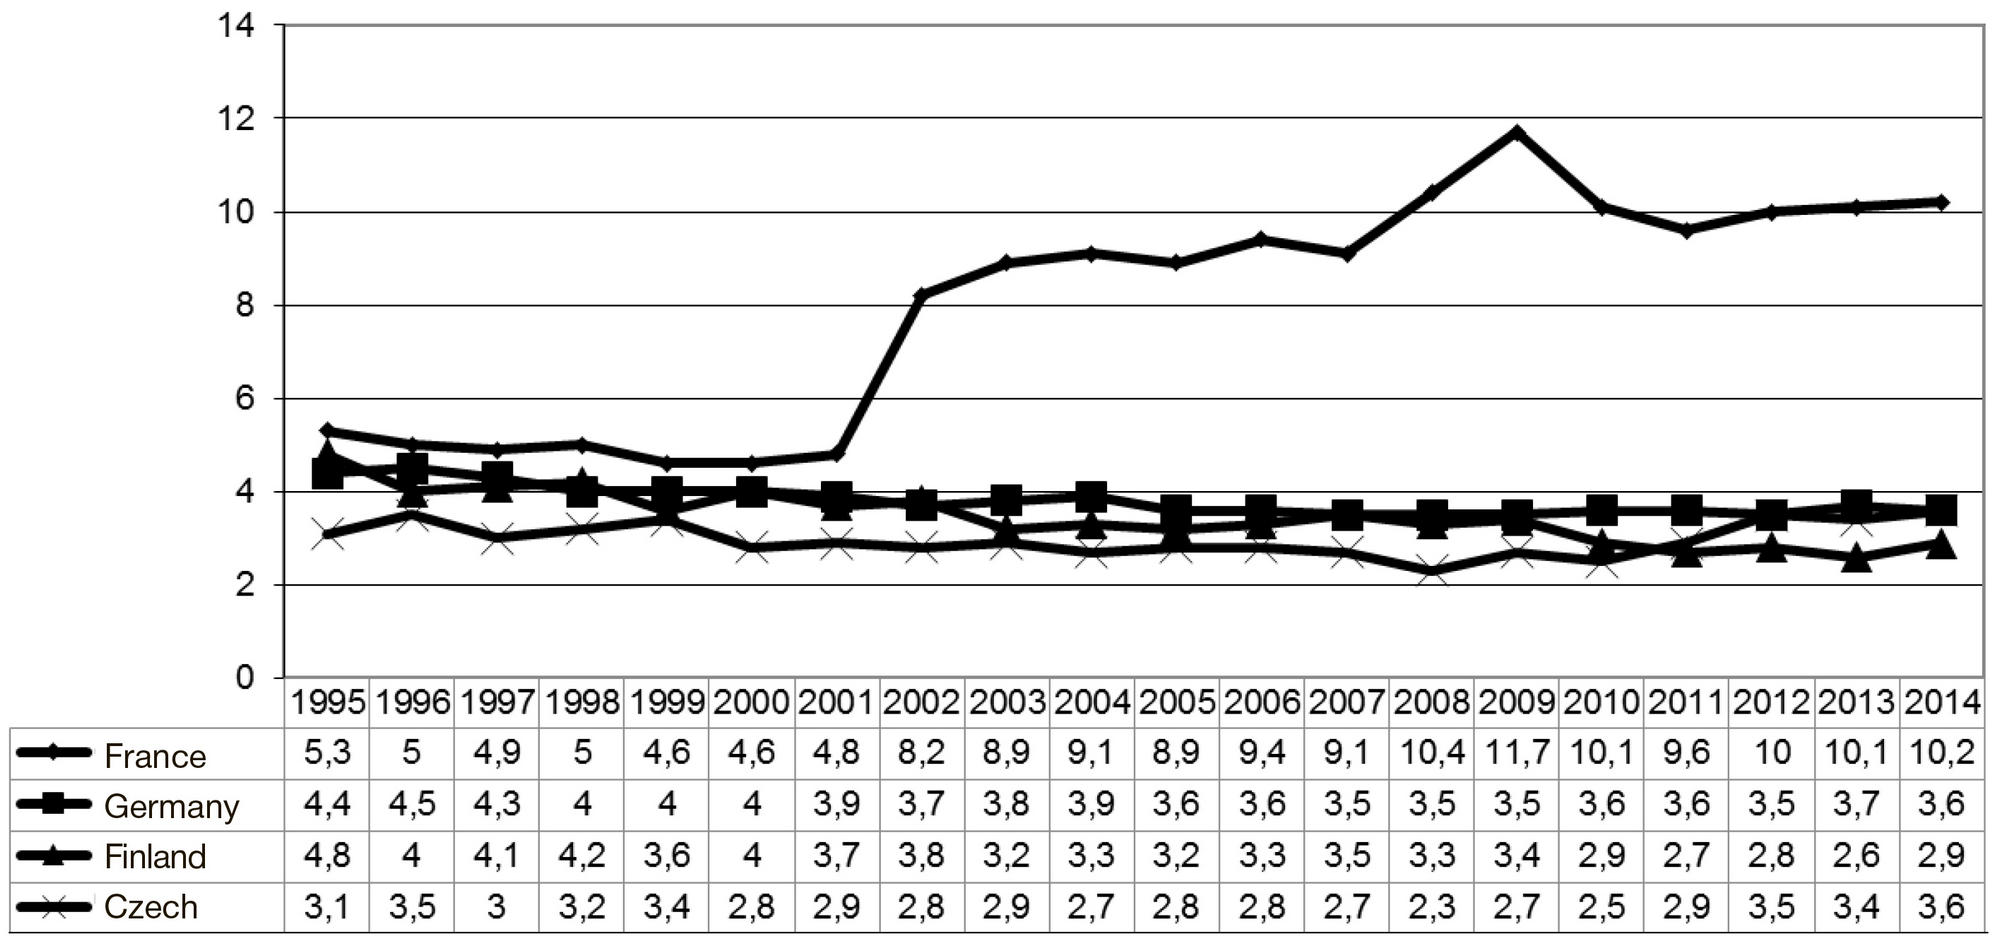
Fig. 5. Stillbirth rate in France, Germany, Finland and the Czech Republic, boys and girls combined, 1995 to 2014 (per 1,000 births, %)
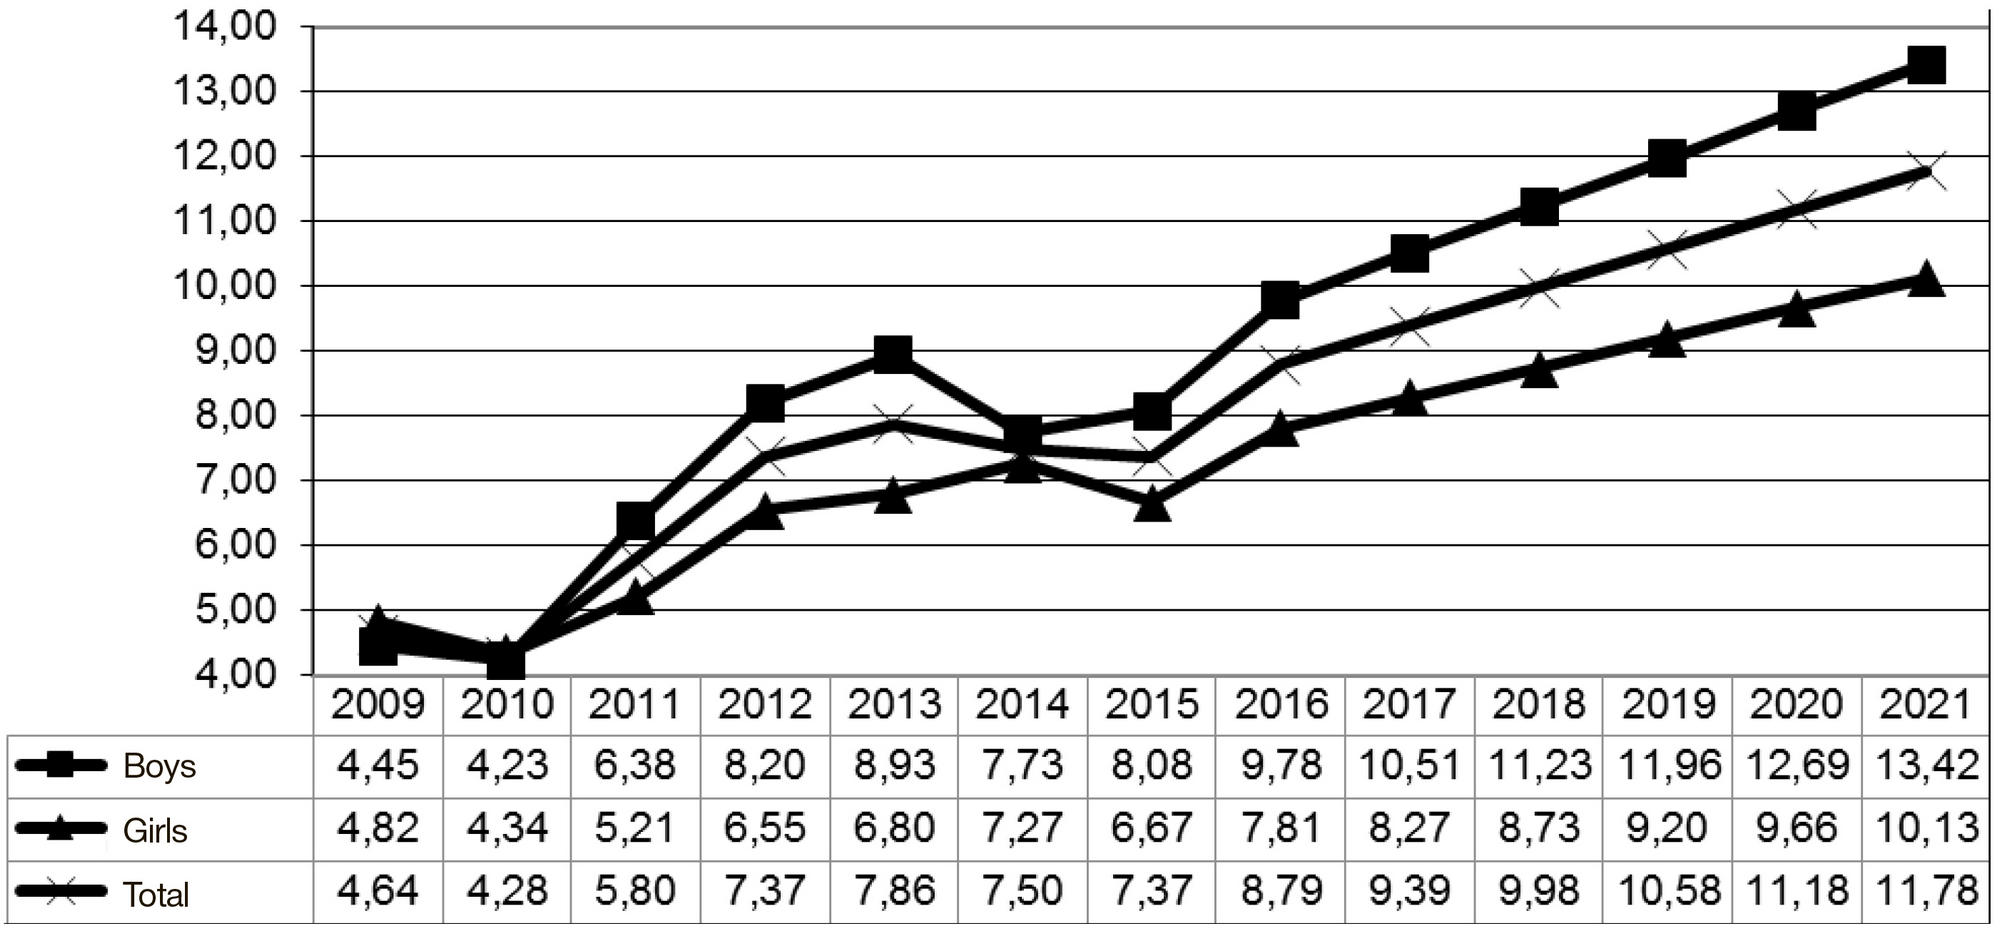
Fig. 6. Stillbirth rate, dynamics, boys and girls, Bryansk region, 2009–2015 and 2016–2021 linear forecast (per 1,000 births, %)
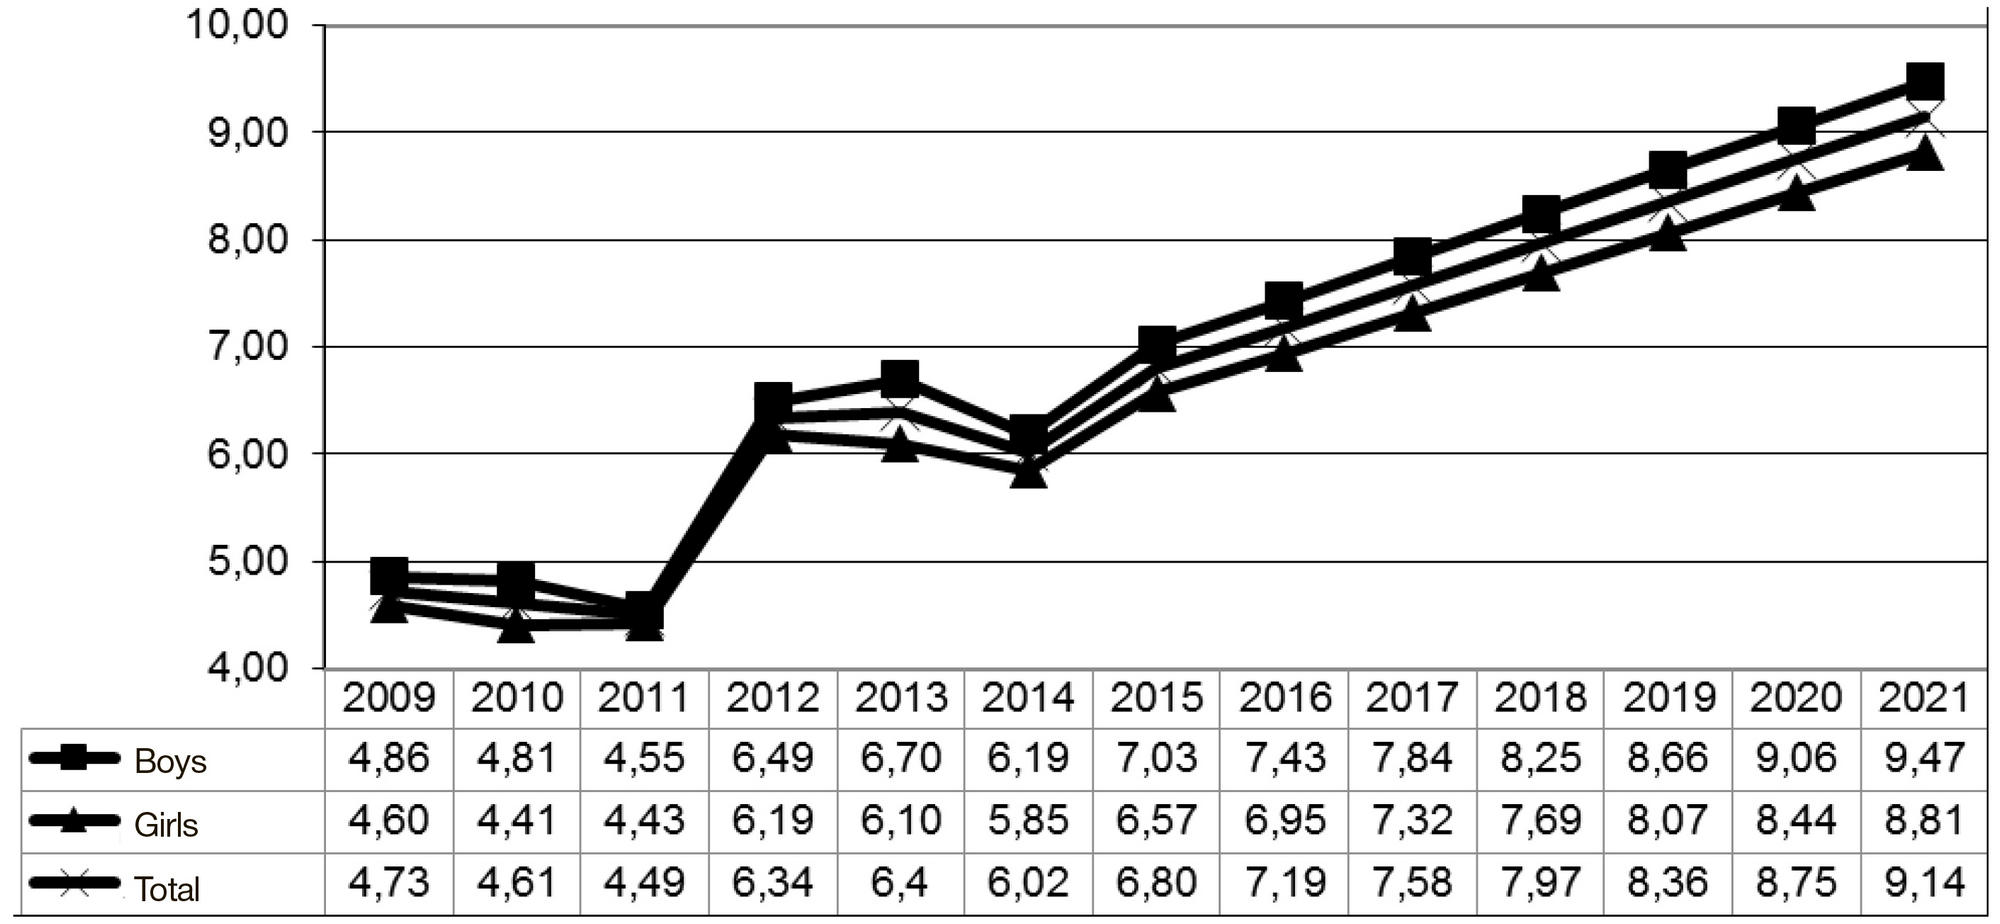
Fig. 7. Stillbirth rate, dynamics, boys and girls, Russian Federation, 2009–2014 and 2016–2021 linear forecast (per 1,000 births, %)
Table 1. Stillbirth rate in Bryansk region and the Russian Federation, 1995–2014, boys and girls, per 1,000 births, M ± m

Note: difference between male and female stillbirth rate in Bryansk region and in the Russian Federation, p > 0.05; difference between male stillbirth rate in Bryansk region and in the Russian Federation, p < 0.05; difference between female stillbirth rate in Bryansk region and in the Russian Federation, p > 0.05; difference between overall stillbirth rate (boys and girls combined) in Bryansk region and in the Russian Federation, p < 0.05.
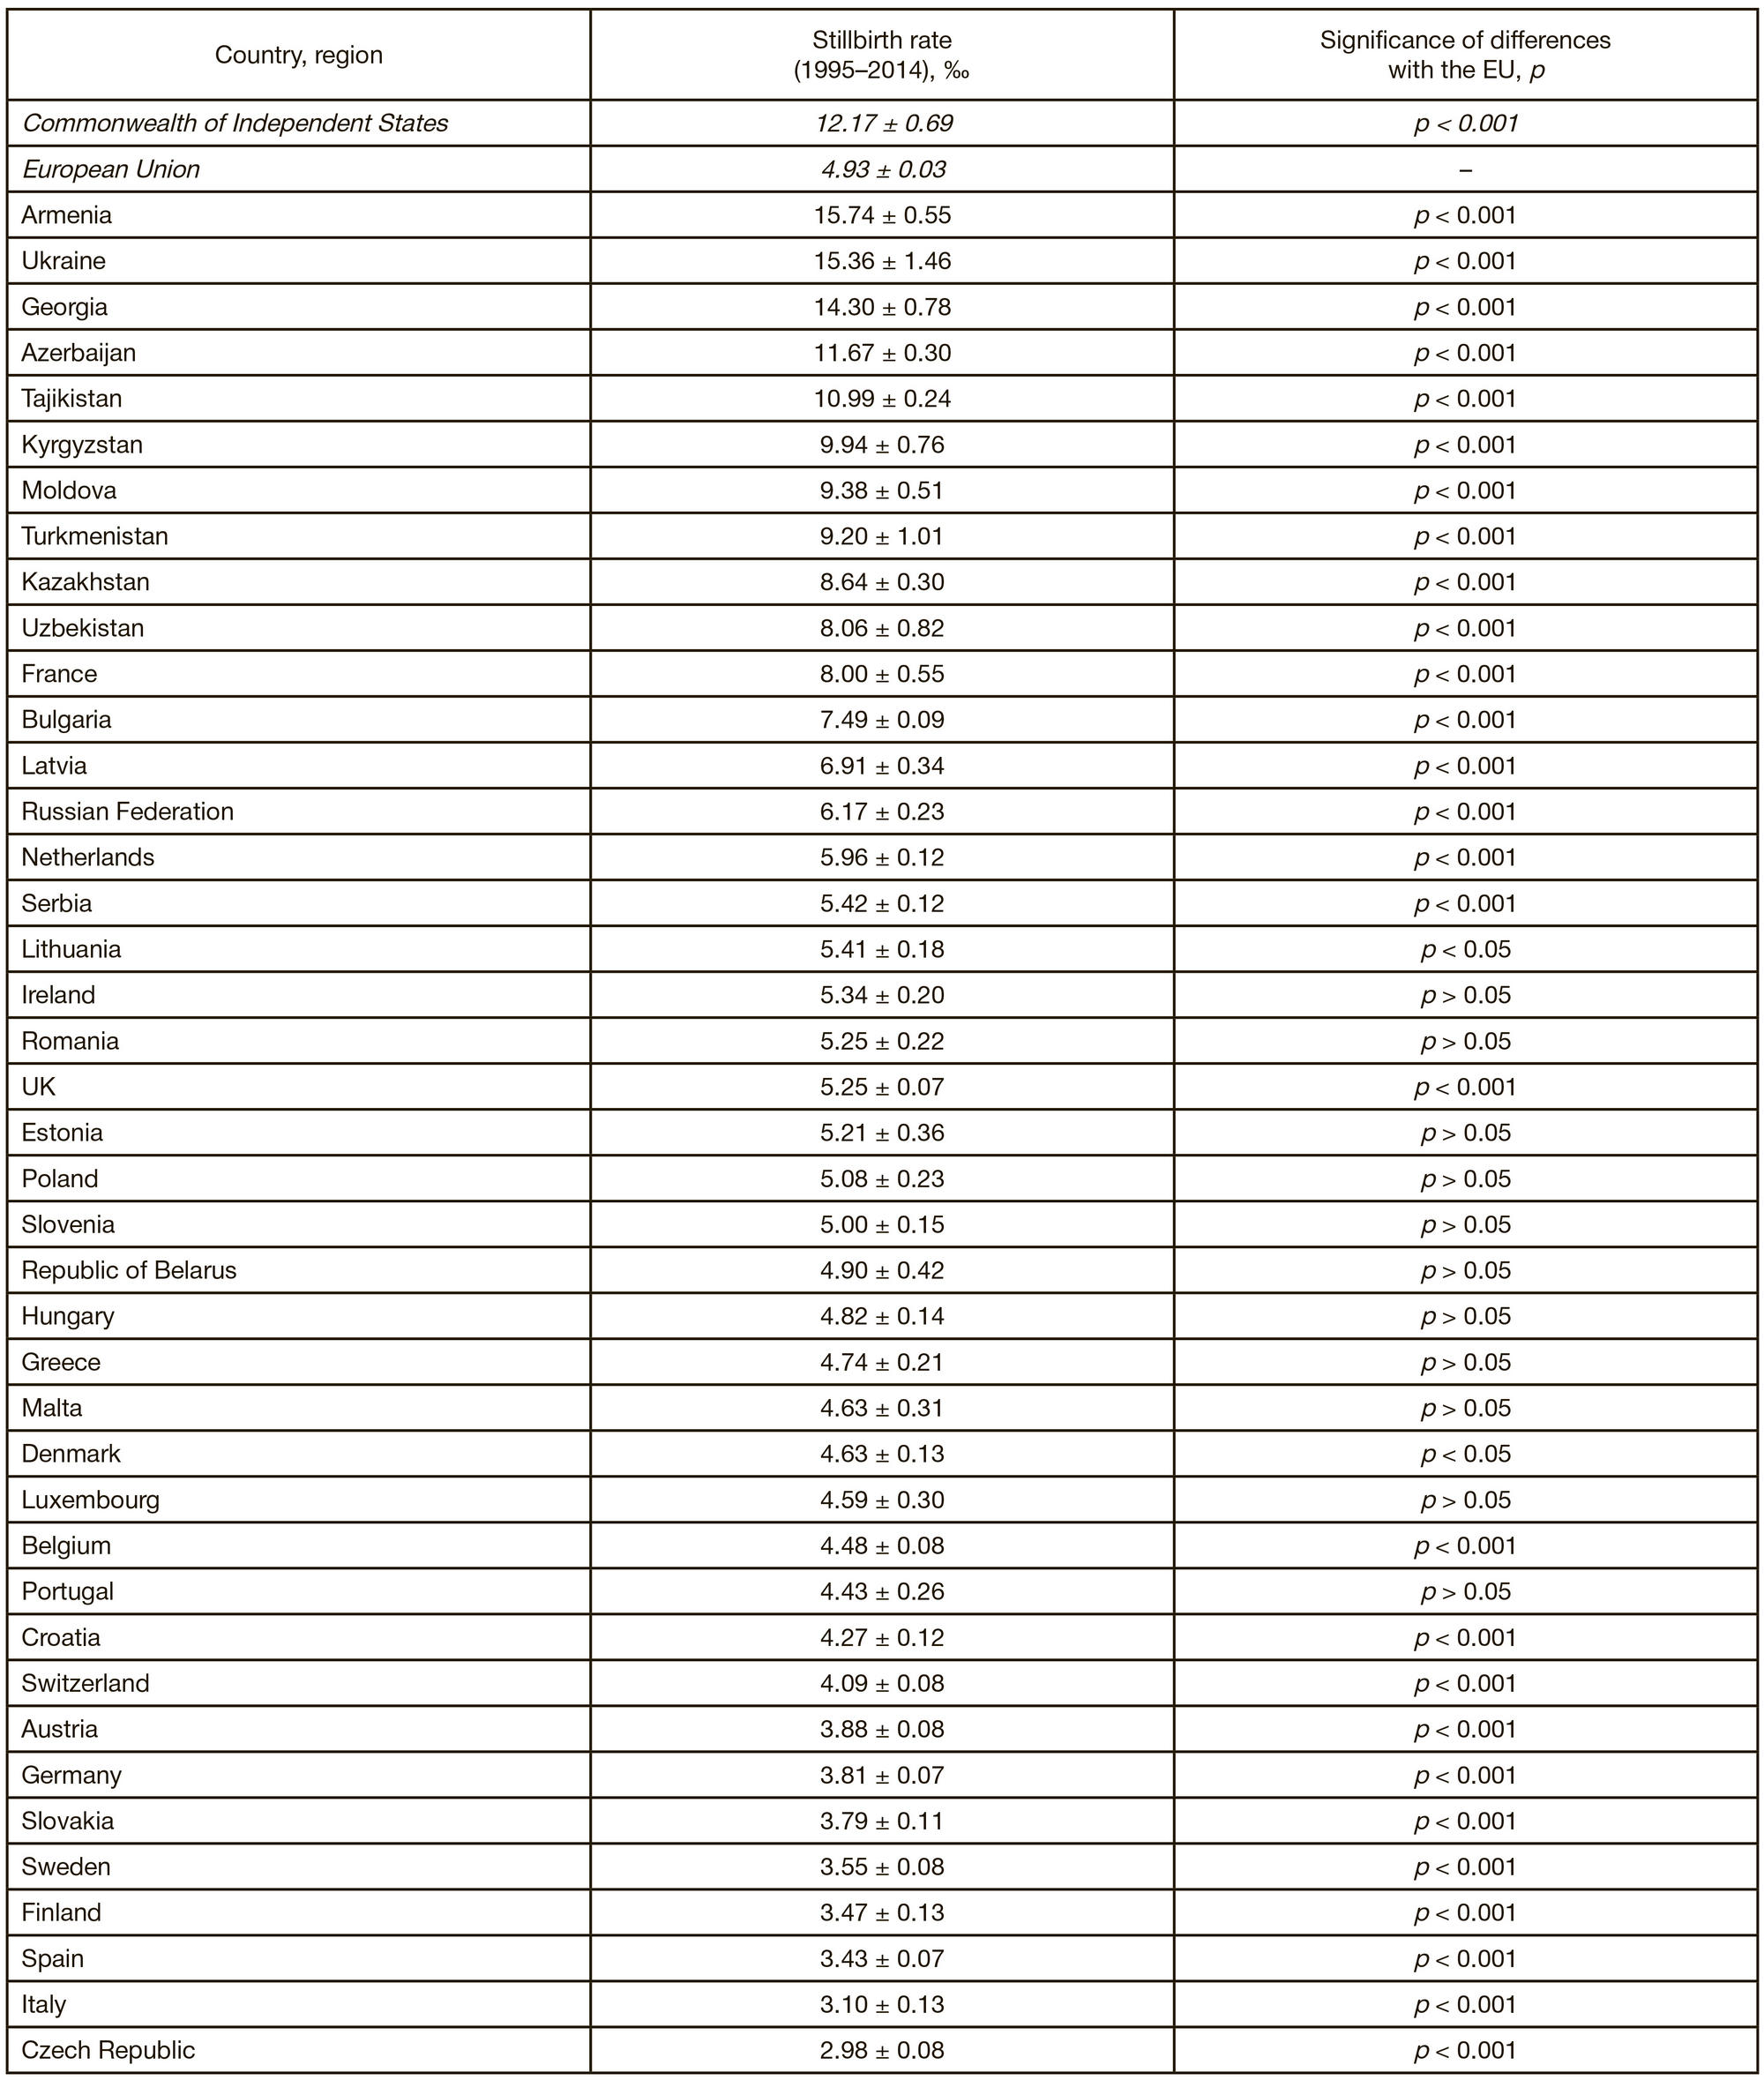
Table 2. Stillbirth rate in the EU and CIS countries, 1995–2014, boys and girls combined, per 1,000 births, M ± m