OPINION

Promising methods for noninvasive medical diagnosis based on the use of nanoparticles: surface-enhanced raman spectroscopy in the study of cells, cell organelles and neurotransmitter metabolism markers

Goodilin EA1,2, Semenova AA2, Eremina OE1, Brazhe NA3, Goodilinа EA4, Danzanova TYu4, Maksimov GV3, Veselova IA1
About authors

1 Faculty of Chemistry, Lomonosov Moscow State University, Moscow

2 Faculty of Materials Science, Lomonosov Moscow State University, Moscow

3 Faculty of Biology, Lomonosov Moscow State University, Moscow

4 Blokhin Russian Cancer Research Center, Moscow

Correspondence should be addressed: Eugene А. Goodilin
Leninskie gory, 1 bl. 3, Moscow, 119992; ur.xednay@nilidoog

About paper

Funding: this work was supported by the Russian Science Foundation (Grant 14-13-00871).

Acknowledgments: the authors wish to thank Professor Chekhonin VP, who graciously agreed to collaborate on this project, Nickelsparg E. for her assistance in preparing the figures for the manuscript, and Professor Sinukova GT for the fruitful discussion of contrast-enhanced ultrasound diagnostics.

Received: 2018-07-20 Accepted: 2018-08-19 Published online: 2018-12-26
|
Fig. 1. Contrasting agents in medical imaging (photos are provided by the authors of this article). A, B. A contrast-enhanced ultrasound scan of the liver with a metastatic lesion: A — the arterial phase (14 seconds after the injection of SonoVue), 1 — peripheral enhancement; 2 — no enhancement in the central region; B — the gray-scale B-mode. C. A contrast-enhanced MR image of a rat’s spleen (enhancement with iron oxide PEG-shell nanoparticles)
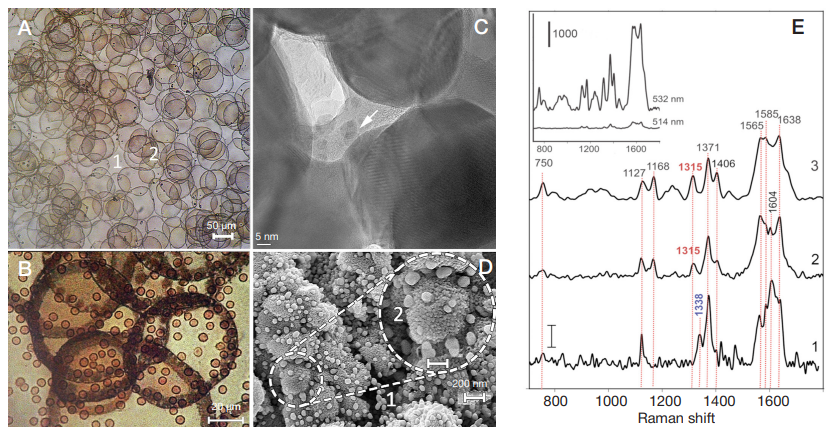
Fig. 2. The Ag nanostructured surface for SERS-based analysis. A. An optical microphotograph of silver rings. B. Living red blood cells on the nanostructured surface. C. Nanostructured elements of the surface (Ag nanoparticles in the substrate channels, TEM). D. “Sesame seeds” on the nanostructured substrate (SEM). E. SERS spectra of red blood cells (1) and mitochondria (2 and 3) on the Ag@SiO2 nanocomposite at laser excitation wavelength of 532 nm (1 and 3) and 514 nm (2). For convenience, the spectra were normalized to their total intensity. Figures above the spectra indicate the position of peak maxima. The inset plot shows unnormalized SERS spectra of mitochondria on the Ag@SiO2 nanocomposite at laser excitation wavelength of 514 and 532 nm