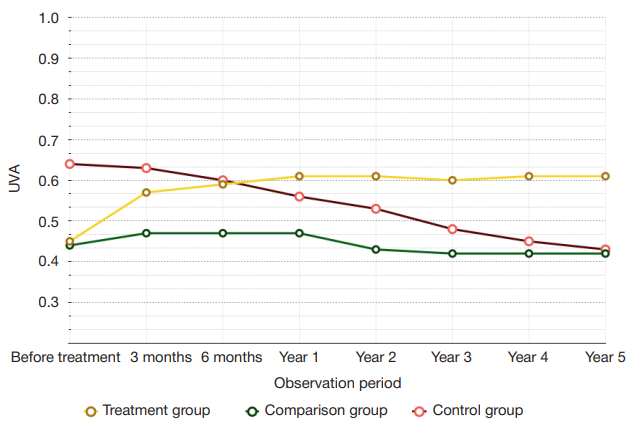
Fig. 1. Mean UVA dynamics, all groups.
Treatment group — yellow line; UVA increased significantly from the 3rd to the 12th month of observation, results persisted throughout the observation period. Comparison group — green line; mean UVA was increasing significantly up to the 3rd month, from the 6th month onward to the end of the observation period the indicators were decreasing significantly. Control group — red line; mean UVA was falling significantly throughout the observation period
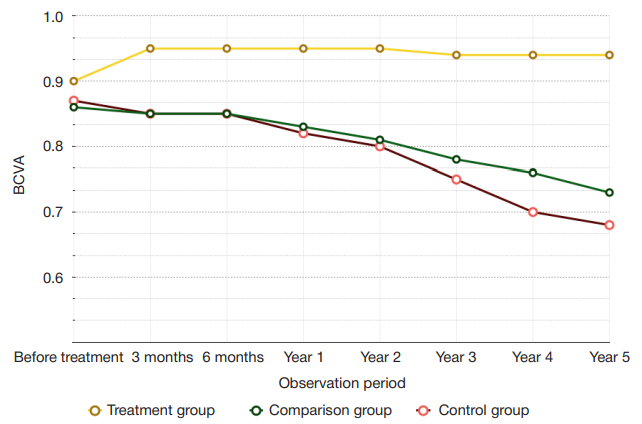
Fig. 2. Mean BCVA dynamics, all groups.
Treatment group — yellow line; BCVA increased significantly from the 3rd to the 12th month of observation, results persisted throughout the observation period. Comparison group — green line; within the first 3 months of observation, mean BCVA changes were insignificant, but from the 12th month on this indicator was decreasing gradually, the difference being significant. Control group — red line; mean BCVA was falling significantly throughout the observation period
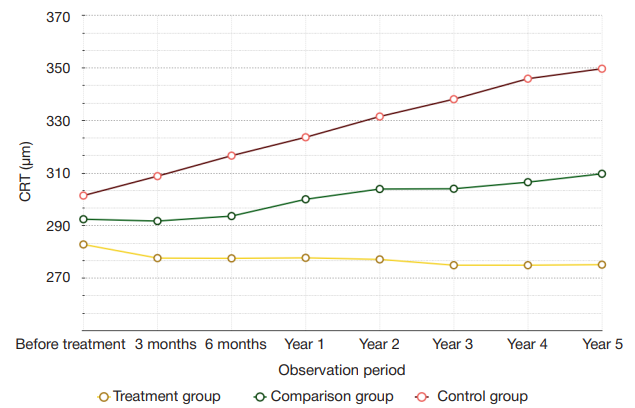
Fig. 3. Mean CRT dynamics, all groups.
Treatment group — yellow line; the analysis of mean CRT did not reveal significant differences from the benchmark data within the first 6 months, but from the 12th month on, this indicator was increasing significantly. Comparison group — green line; the analysis of mean CRT did not reveal significant differences from the benchmark data within the first 6 months, but from the 12th month on, this indicator was increasing significantly. Control group — red line; mean CRT was increasing significantly from the 3rd month on to the end of the observation period
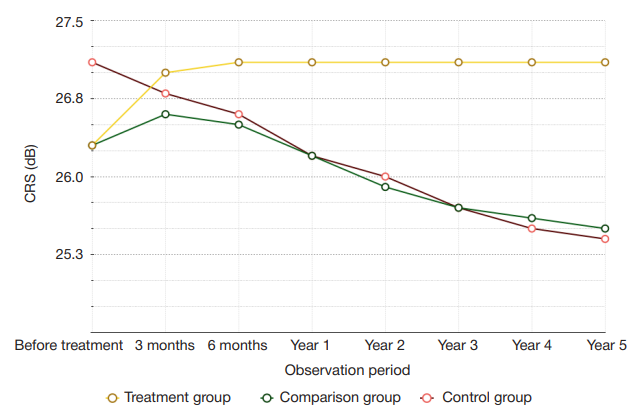
Fig. 4. Mean CRS dynamics, all groups.
Treatment group — yellow line; mean CRS increased significantly from the 3rd to the 12th month of observation, results persisted throughout the observation period. Comparison group — green line; within the first 12 months of observation, mean CRS changes were insignificant, but from the 2nd to the 5th year of observation the indicator decreased significantly. Control group — red line; mean CRS was decreasing significantly from the 3rd month on to the end of the observation period
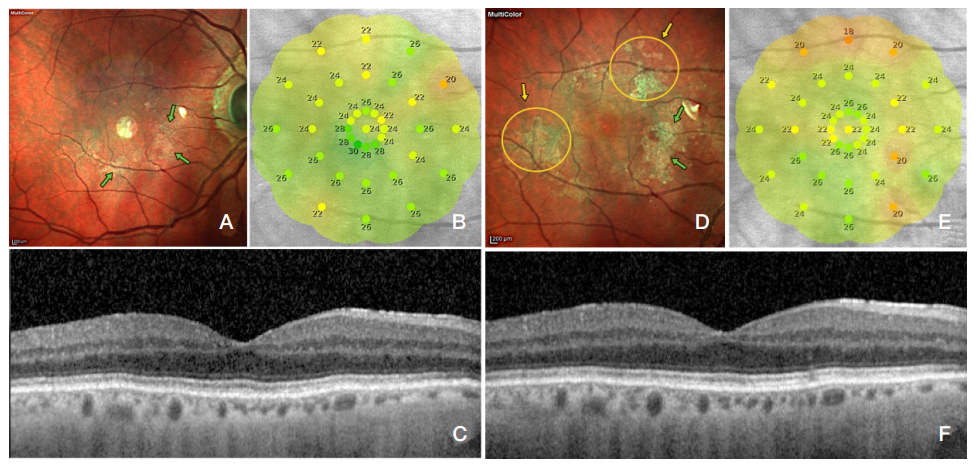
Fig. 5. Control group.
Patient E, 58 years old. Results of the initial examinations: ERM surface and boundaries visualized yellow-green through multispectral imaging (Multicolor) (A); mean CRS (computer microperimetry data) — 24.9 dB (B); SOCT revealed a hyperreflective line on the ILM surface corresponding to the ERM, foveal pit morphology preserved (C). Results of examinations at the end of the 1st year of observation: multispectral imaging showed continued proliferation of ERM with new foci (yellow arrow) and continued growth of the fibrosis area (green arrow) (D); Mean CRS — 23.5 dB (E); SOCT revealed persistence of ERM on the ILM surface, foveal pit morphology preserved (F)
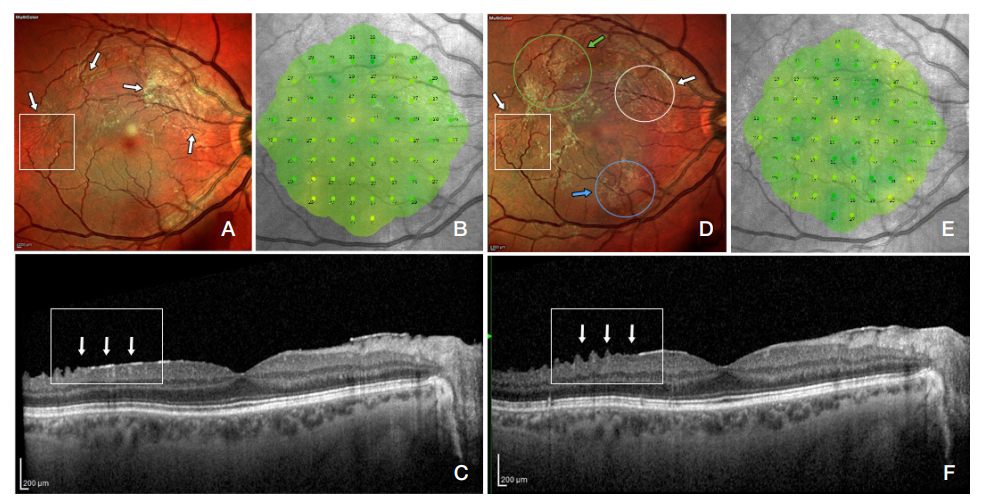
Fig. 6. Comparison group. Patient S., 56 years old. Results of the initial examinations: ERM surface and boundaries visualized yellow-green through multispectral imaging (Multicolor; white arrow) (A); mean CRS (computer microperimetry data) — 28.2 dB (B); SOCT revealed a hyperreflective line on the ILM surface corresponding to the ERM (white arrow), foveal pit morphology preserved, CRT — 239 μm (C). Results of examinations at the end of the 2nd year of observation: multispectral imaging showed laser coagulates and the resulting ERM involution spots (white arrow), ERM activation spots (green arrow) and new fibrosis foci (blue arrow) (D); mean CRS — 27.8 dB (E); SOCT revealed an almost complete absence of hyperreflective line (ERM) (white arrow), corresponding to the Multicolor visualized zone (white rectangle), foveal pit morphology preserved, CRT — 237 μm (F)
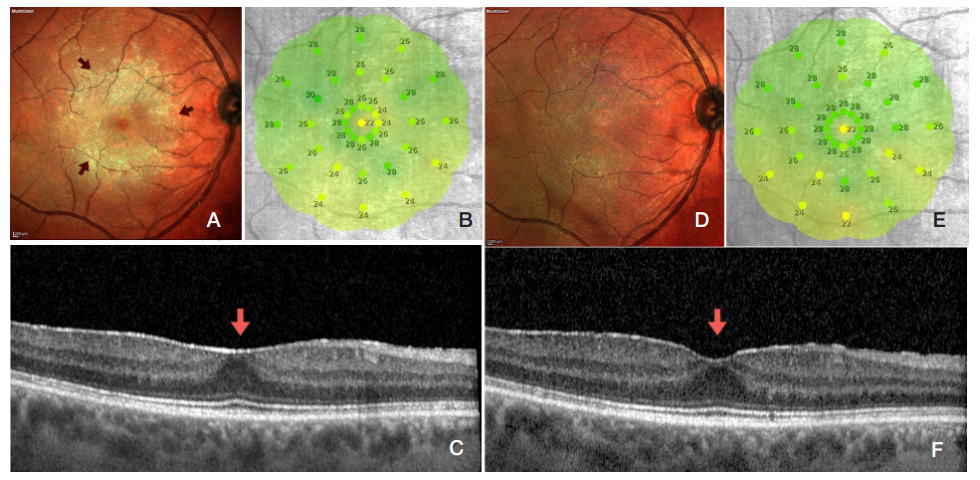
Fig. 7. Treatment group. Patient I, 68 years old. Results of the initial examinations: ERM surface and boundaries visualized yellow-green through multispectral imaging (Multicolor; red arrow) (A); mean CRS (computer microperimetry data) — 26.3 dB (B); SOCT revealed a hyperreflective line on the ILM surface corresponding to the ERM, foveal pit morphology flat (red arrow), CRT — 257 μm (C). Results of examinations at the end of the 5th year of observation: multispectral imaging showed total involution of ERM (D); mean CRS — 26.6 dB (E); SOCT revealed a less "solid" hyperreflective line (ERM) and forming foveal pit morphology (red arrow), CRT — 234 µm (F)
Table 1. Protocol of the developed combined laser treatment technique for idiopathic ERM
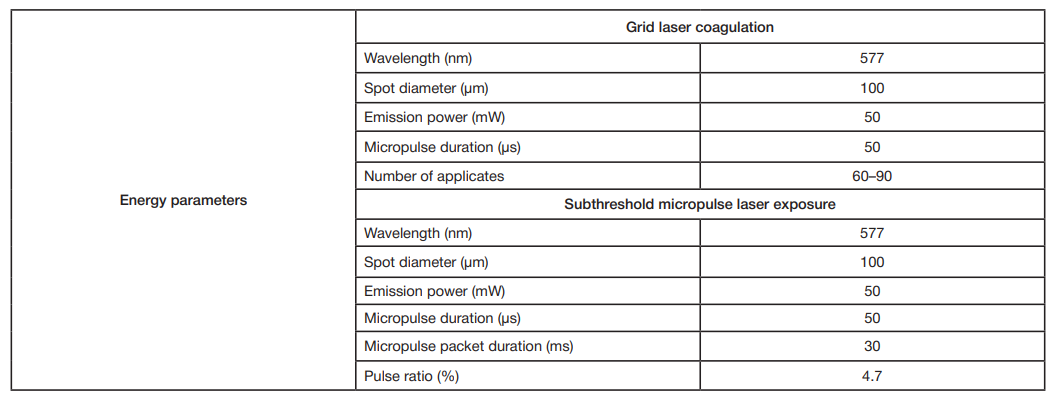
Table 2. Clinical and functional results of treatment of patients (clinical groups)
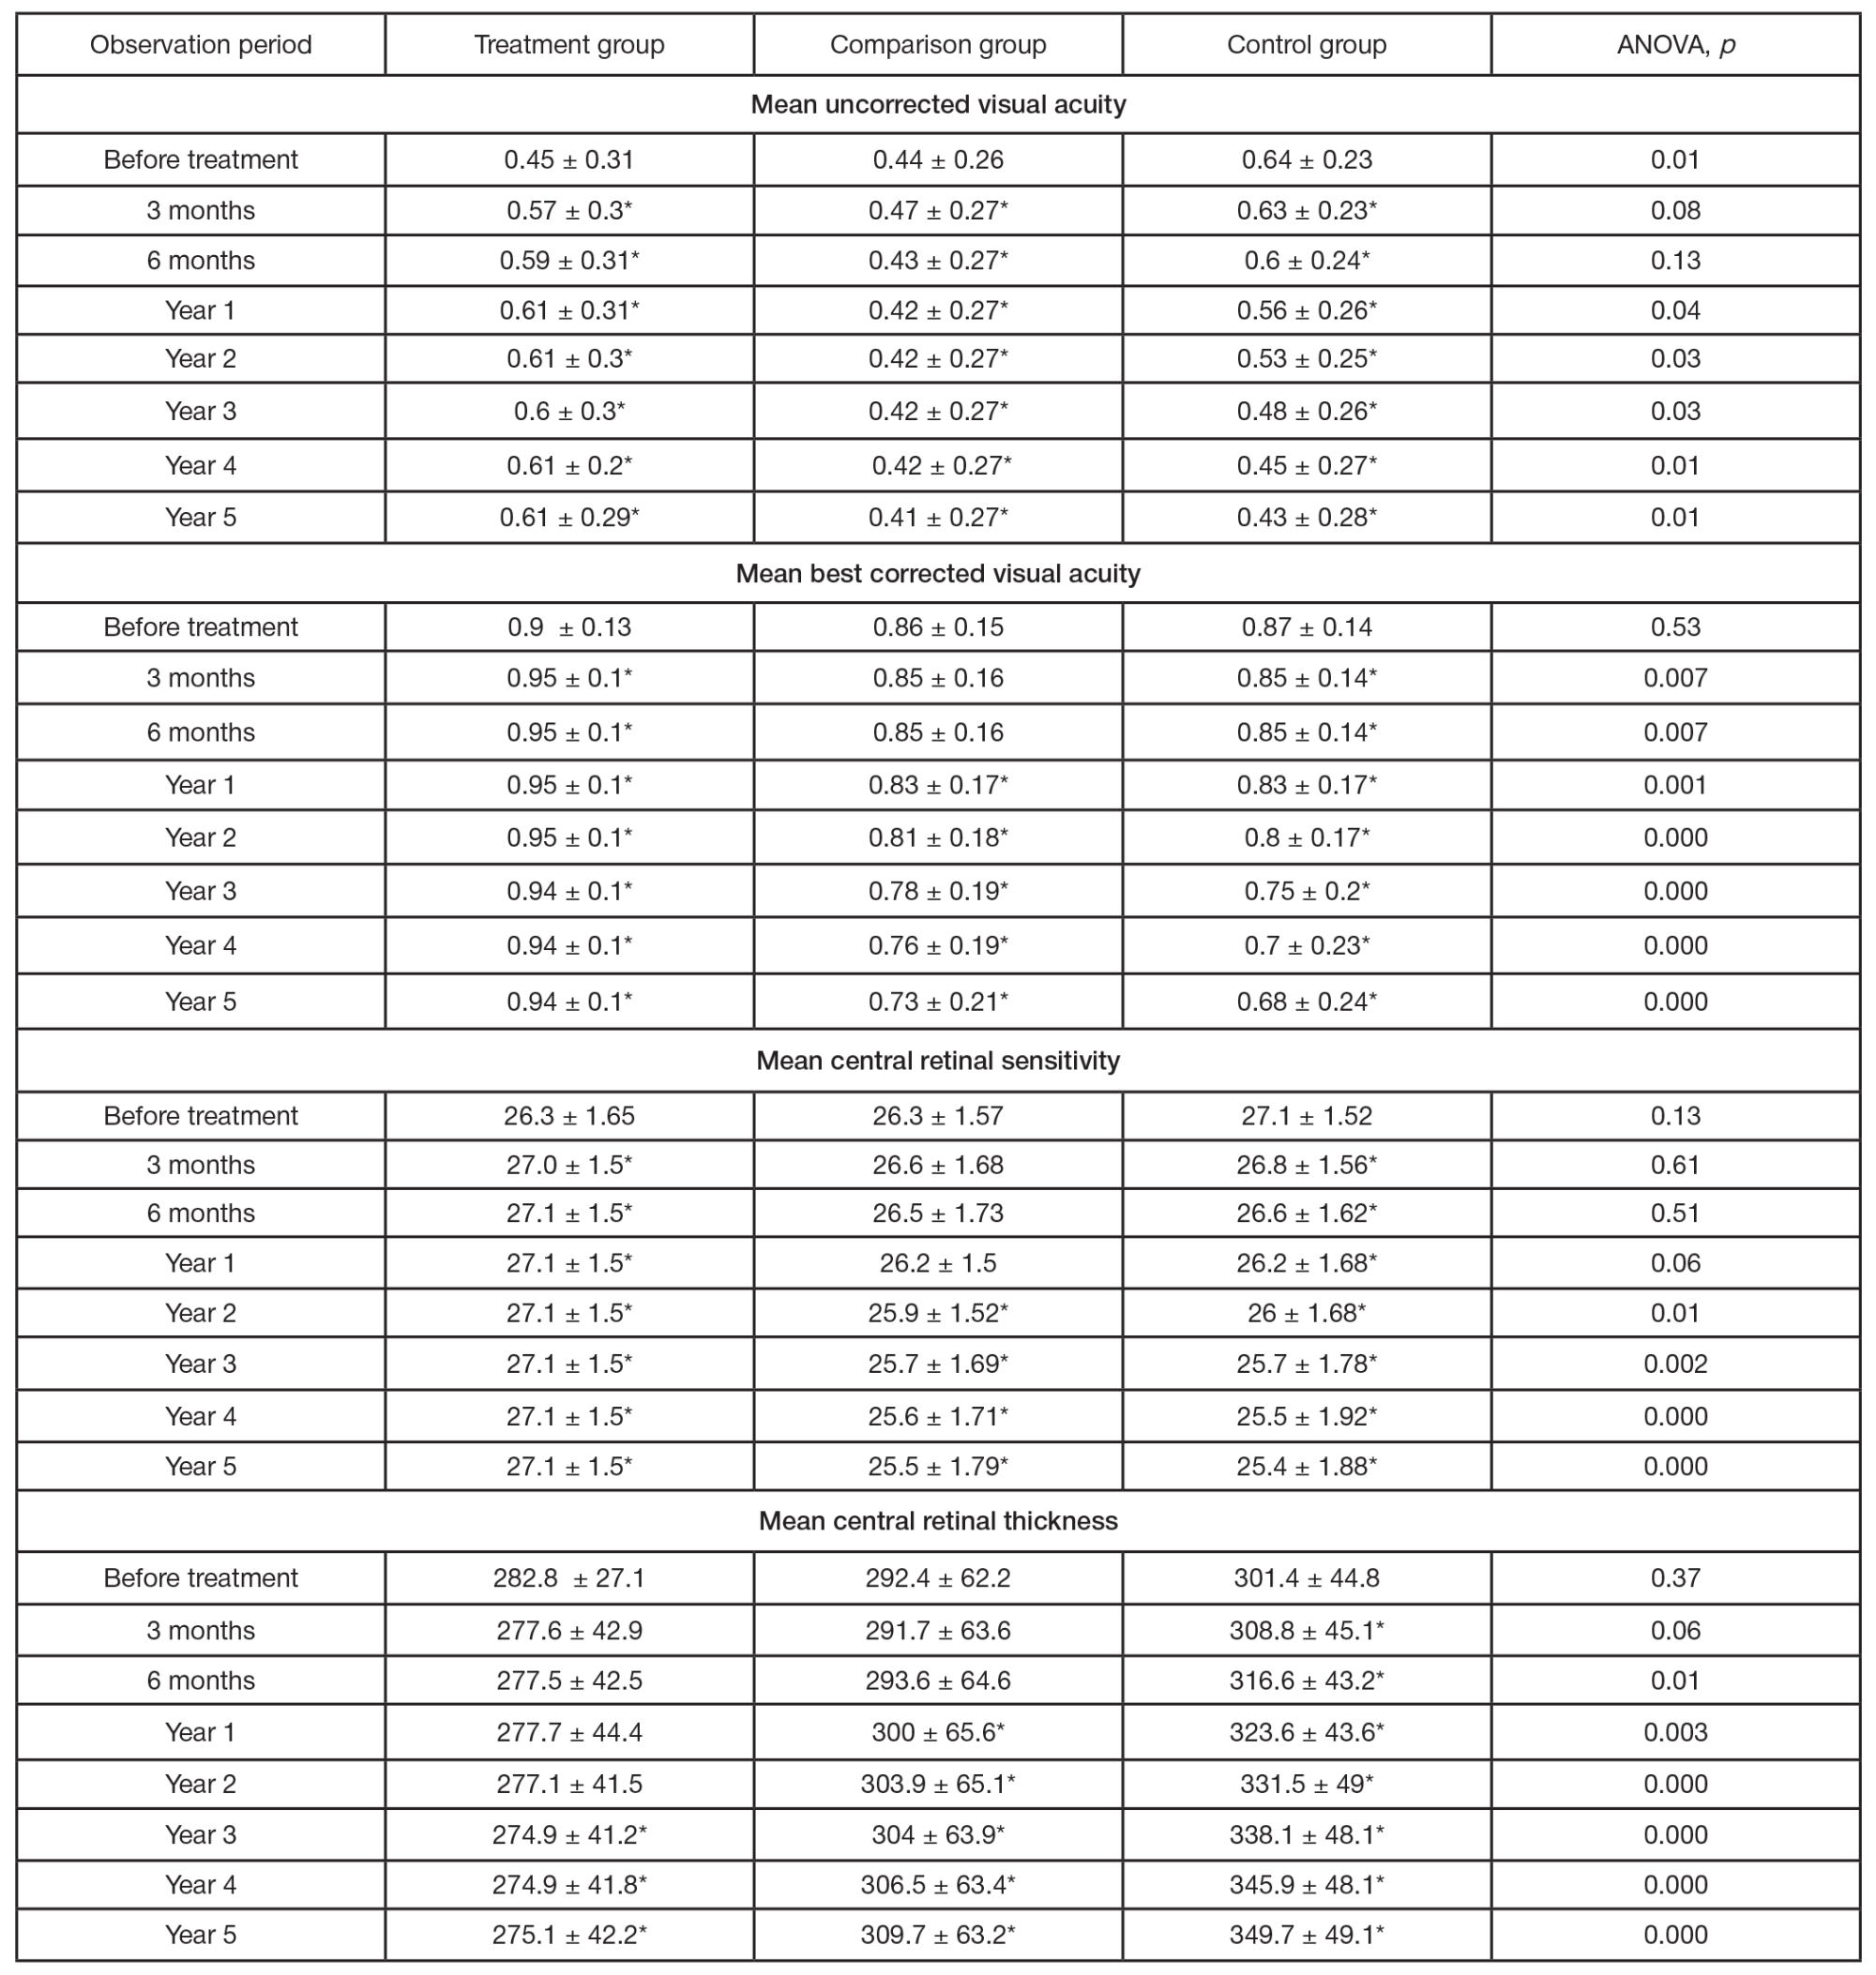
Note: * — significant difference from benchmark data, paired sample t-test (p < 0.05), ANOVA (i>p < 0.05).

