CLINICAL CASE

Retinal laser photocoagulation in management of eales' disease

About authors

Pirogov Russian National Research Medical University, Moscow, Russia

Correspondence should be addressed: Ekaterina P. Tebina
Volokolamskoe shosse, 30, str. 2, Moscow, 123182; ur.liam@anibetaniretake

About paper

Author contribution: Takhchidi KhP — study concept and design, manuscript editing; Takhchidi EKh — literature analysis; Tebina EP — manuscript writing; Kasminina TA — laser treatment; Mokrunova MV — data acquisition and processing.
Received: 2020-09-20 Accepted: 2020-10-12 Published online: 2020-10-23
|
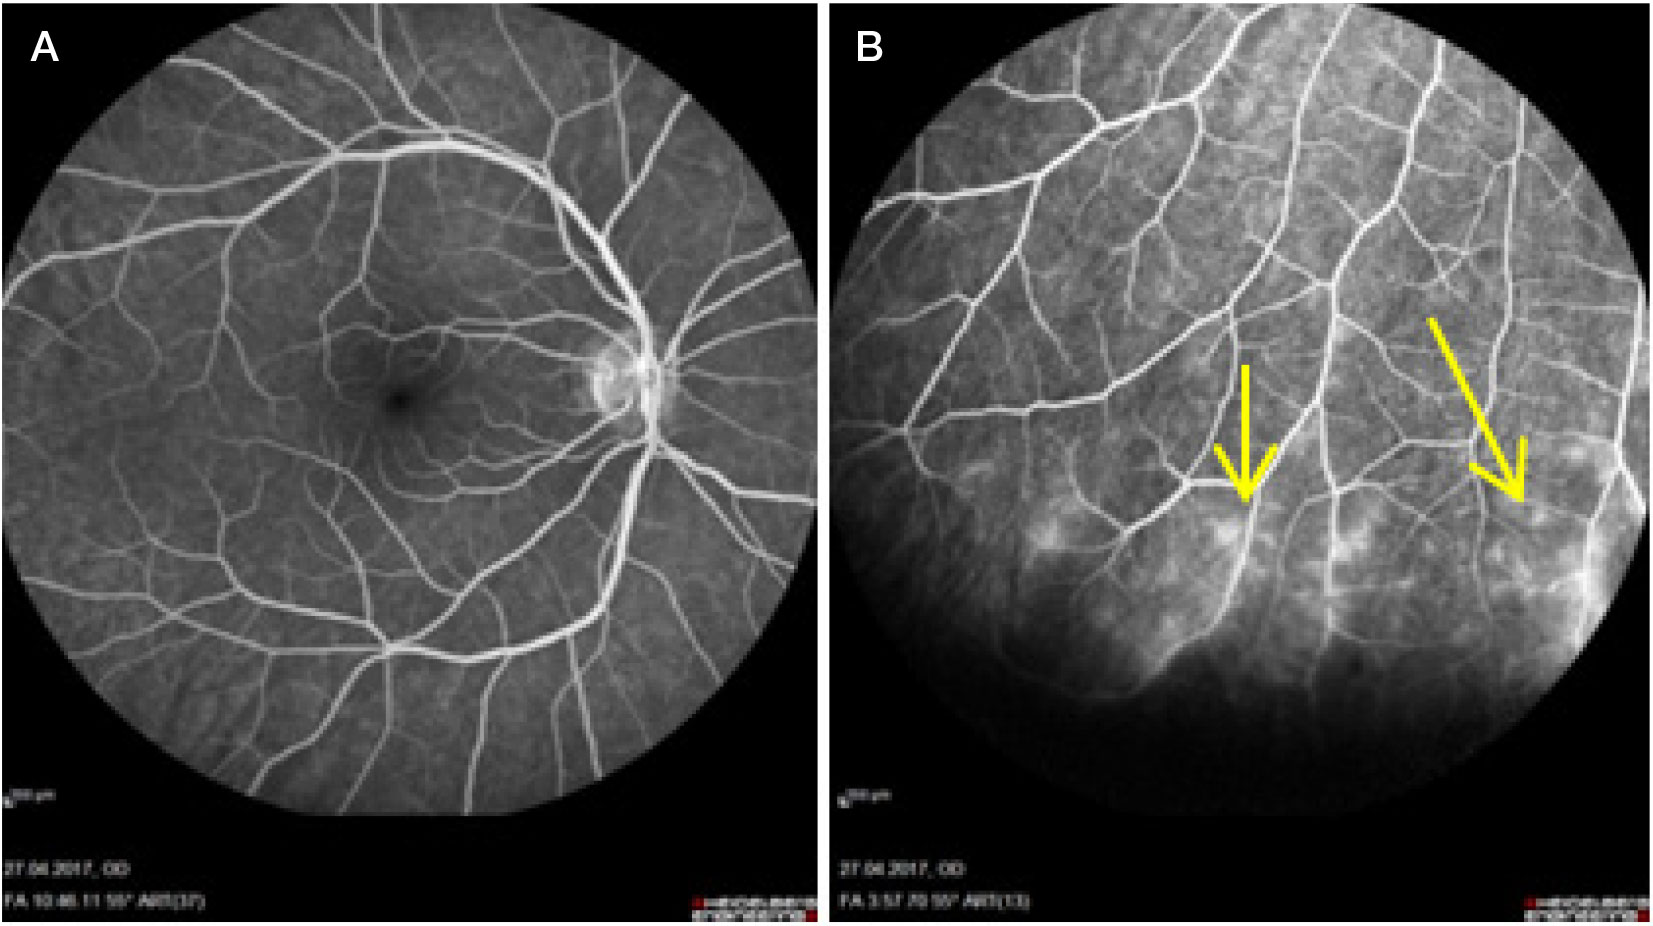
Fig. 1. FA, right eye. А. Optic disc with sharp margins, vascular calibers not altered, A/V ratio 2/3, normal macular area. B. Dye extravasation and aneurisms are visualized in the area of altered blood vessels in the peripheral fundus (yellow arrow)
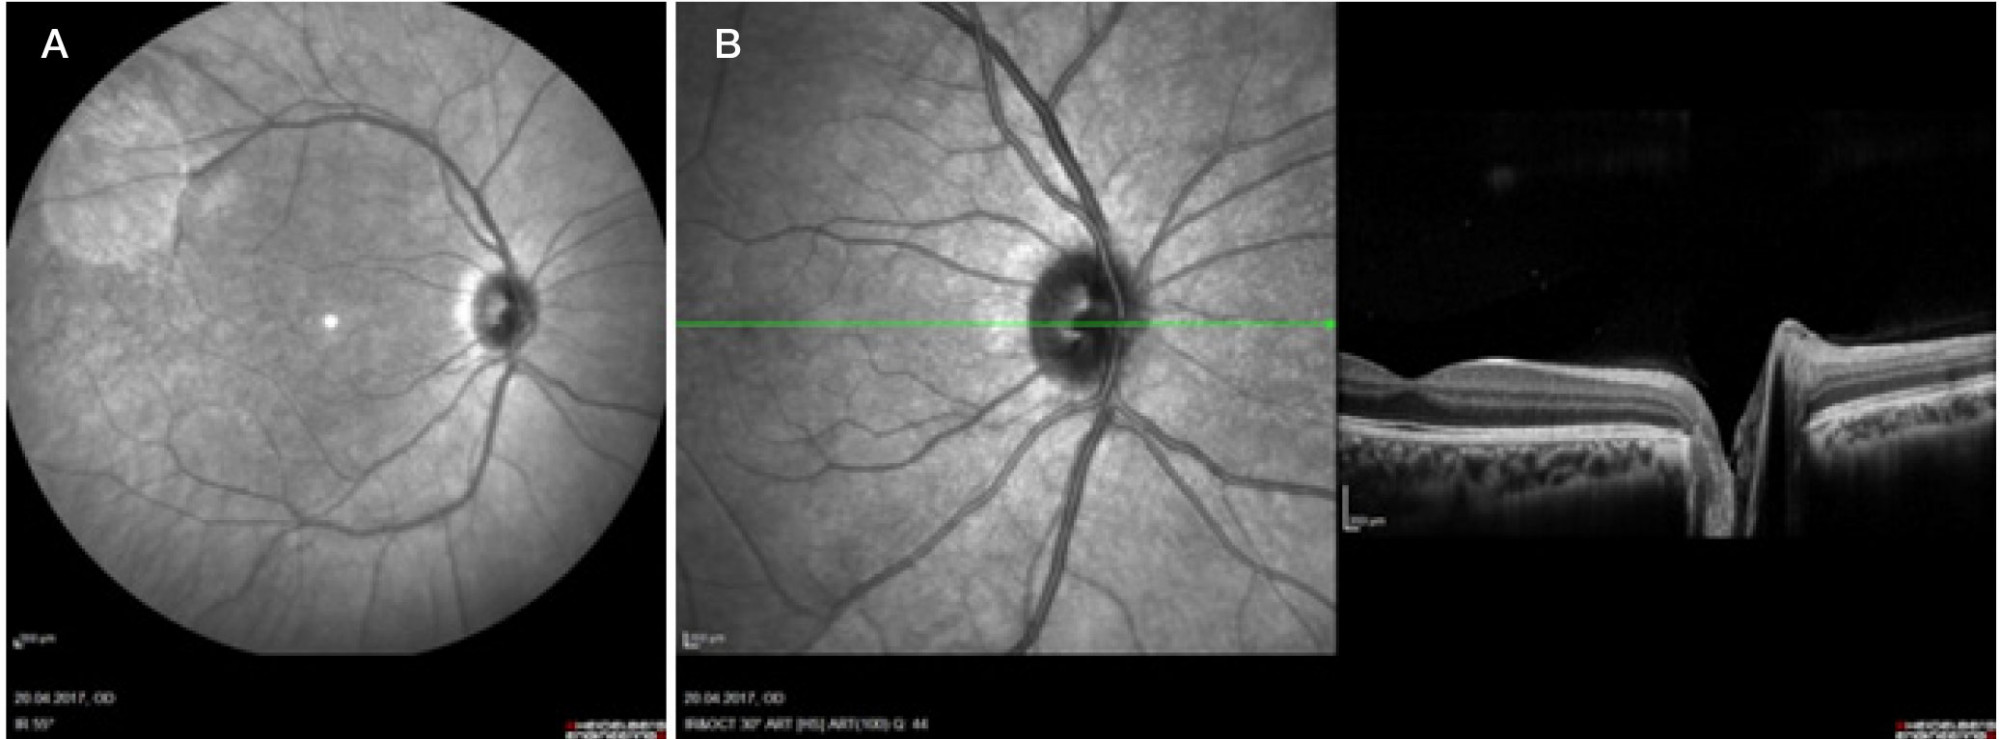
Fig. 2. А. IR reflectance image of fundus, right eye. Optic disc with sharp margins, normal macular area. B. OCT scan of the right eye. Cross-section image with normal optic disc and macular area
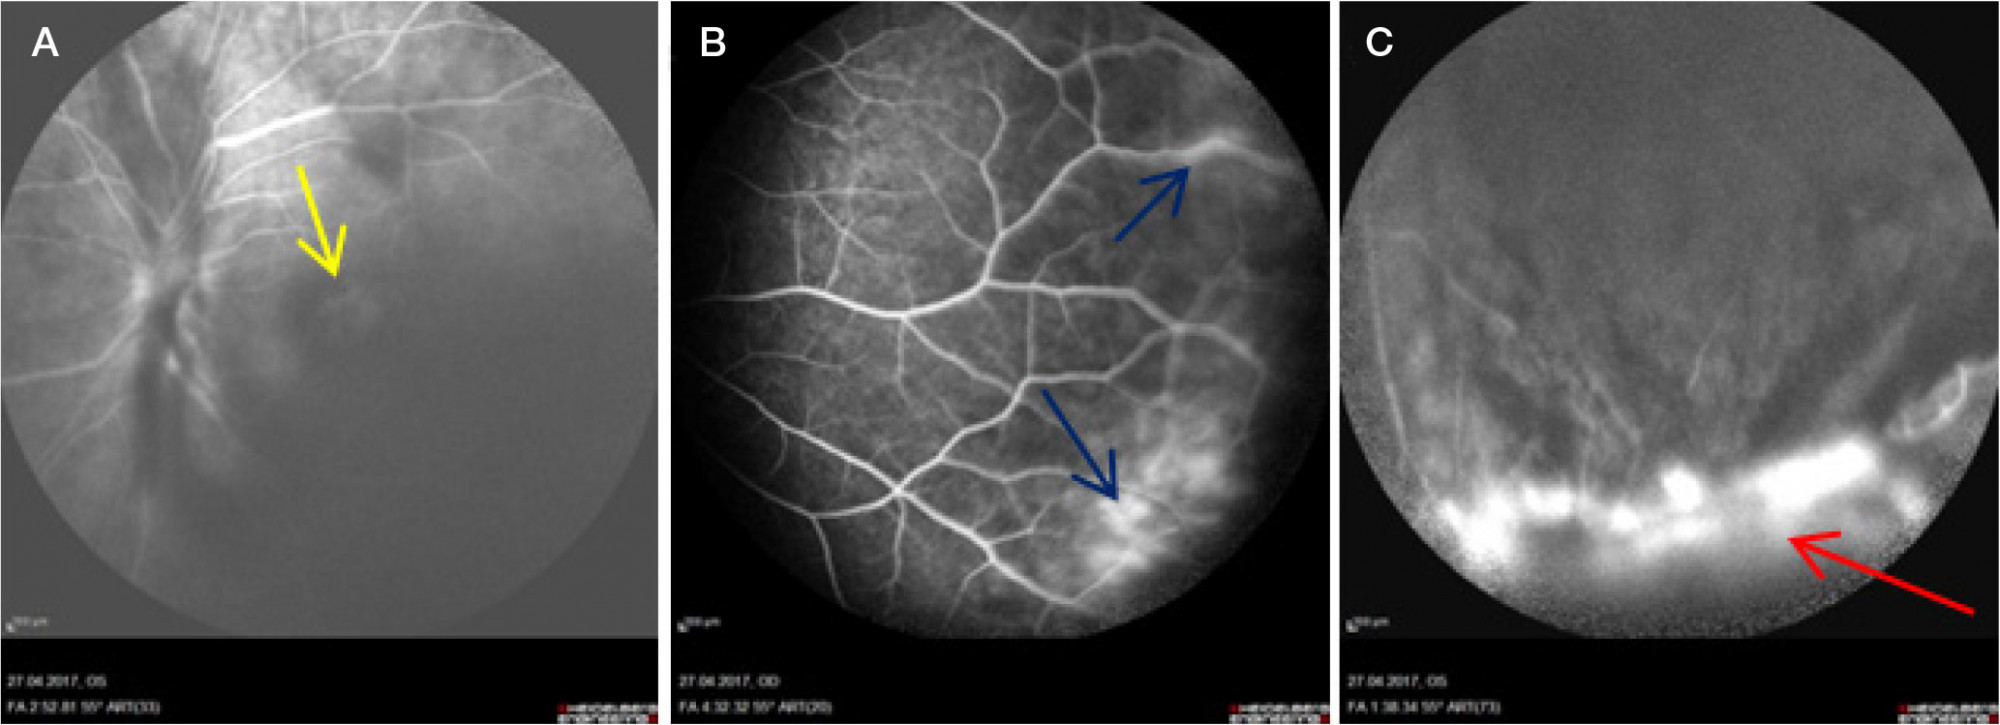
Fig. 3. FA, left eye. А. Optic disc with blurry margins; altered vascular caliber, petaloid (flower-like) pattern of hyperfluorescence is visible through hemophtalmos in central retina (yellow arrow). B. Periphlebitis with dye extravasation across the visible periphery (blue arrows). C. Protruding proliferative lesion with blurry margins visualized as a dense hyperfluorescent focus in the clock hour sector 5 (red arrow); hypofluorescent areas corresponding to hemorrhagic foci
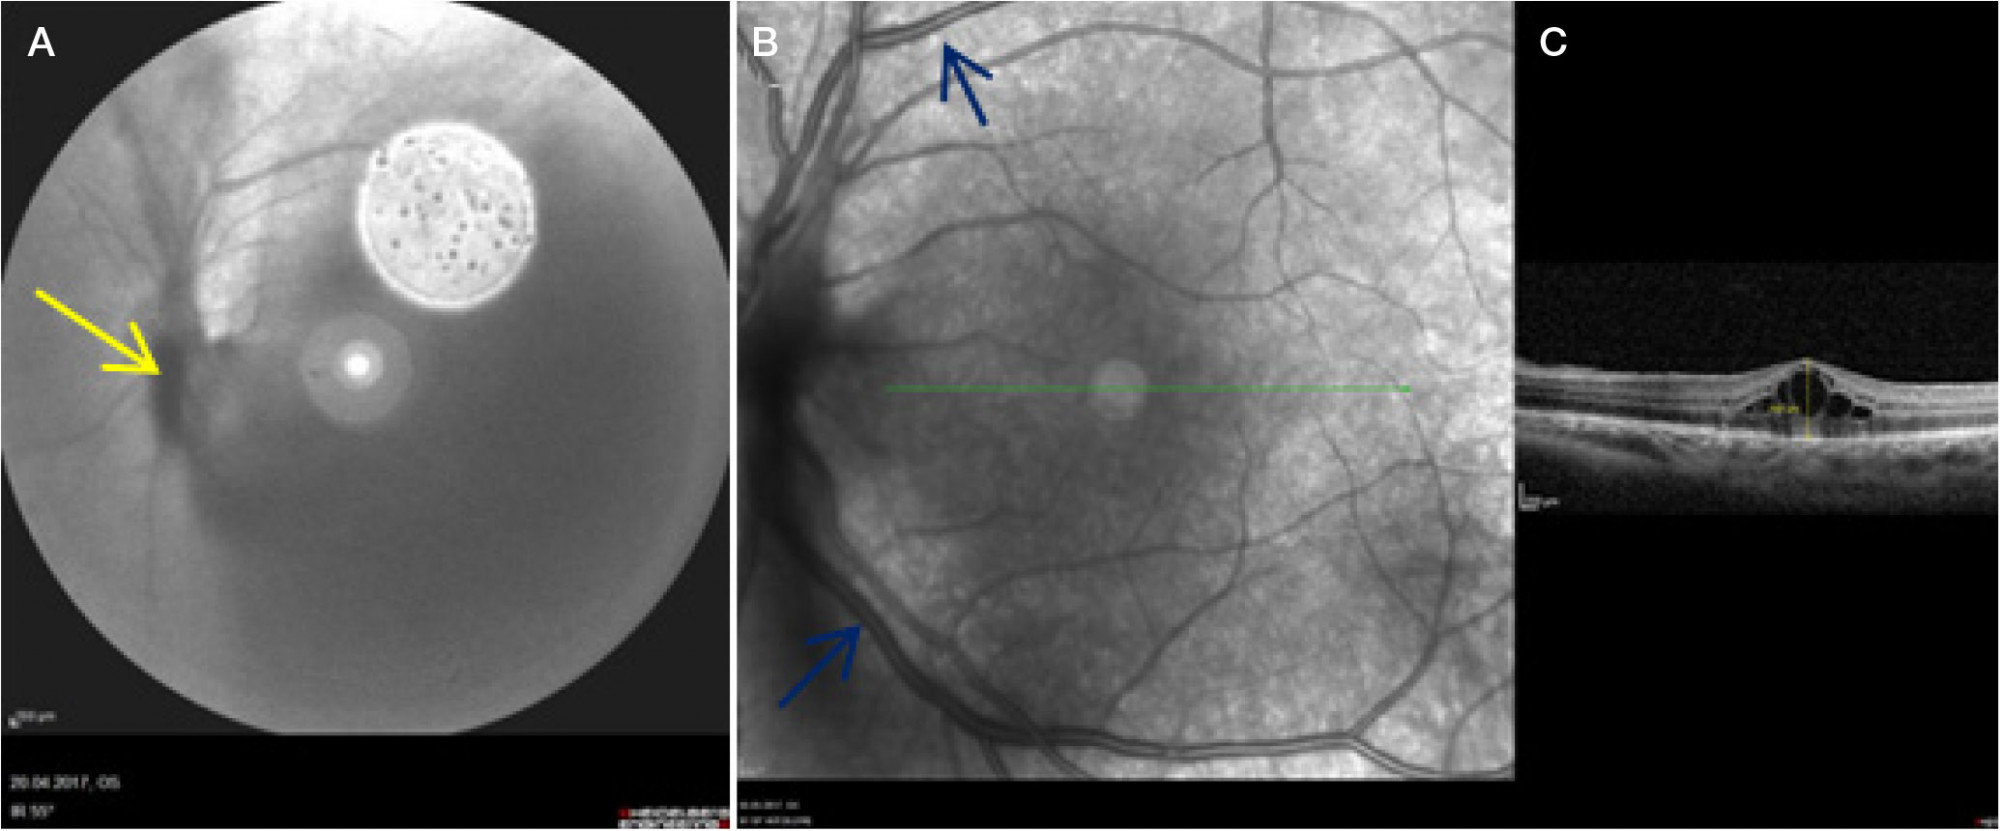
Fig. 4. А. IR reflectance image of fundus, left eye: partial hemophthalmos, fibrous cord over the optic disc extending to the inferior outer quadrant of the retina (yellow arrow). B. IR reflectance image of fundus, left eye: retinal veins dilated and tortuous (blue arrows). C. Macula OCT scan, left eye: cystoid edema 600 μm
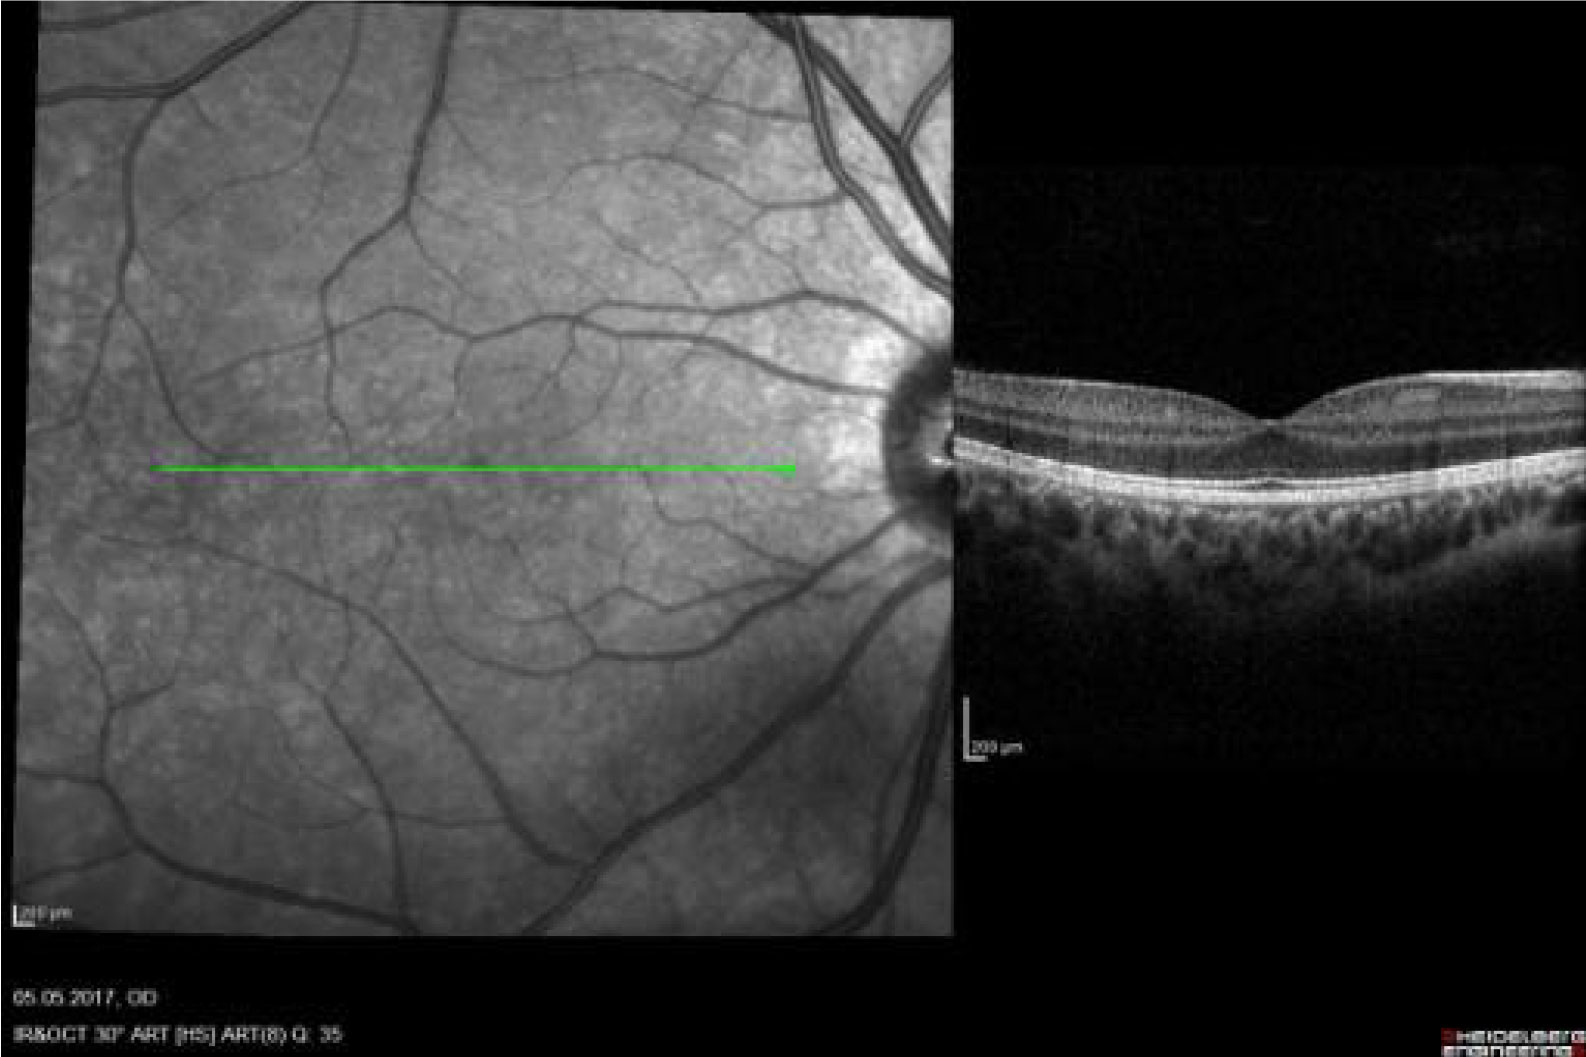
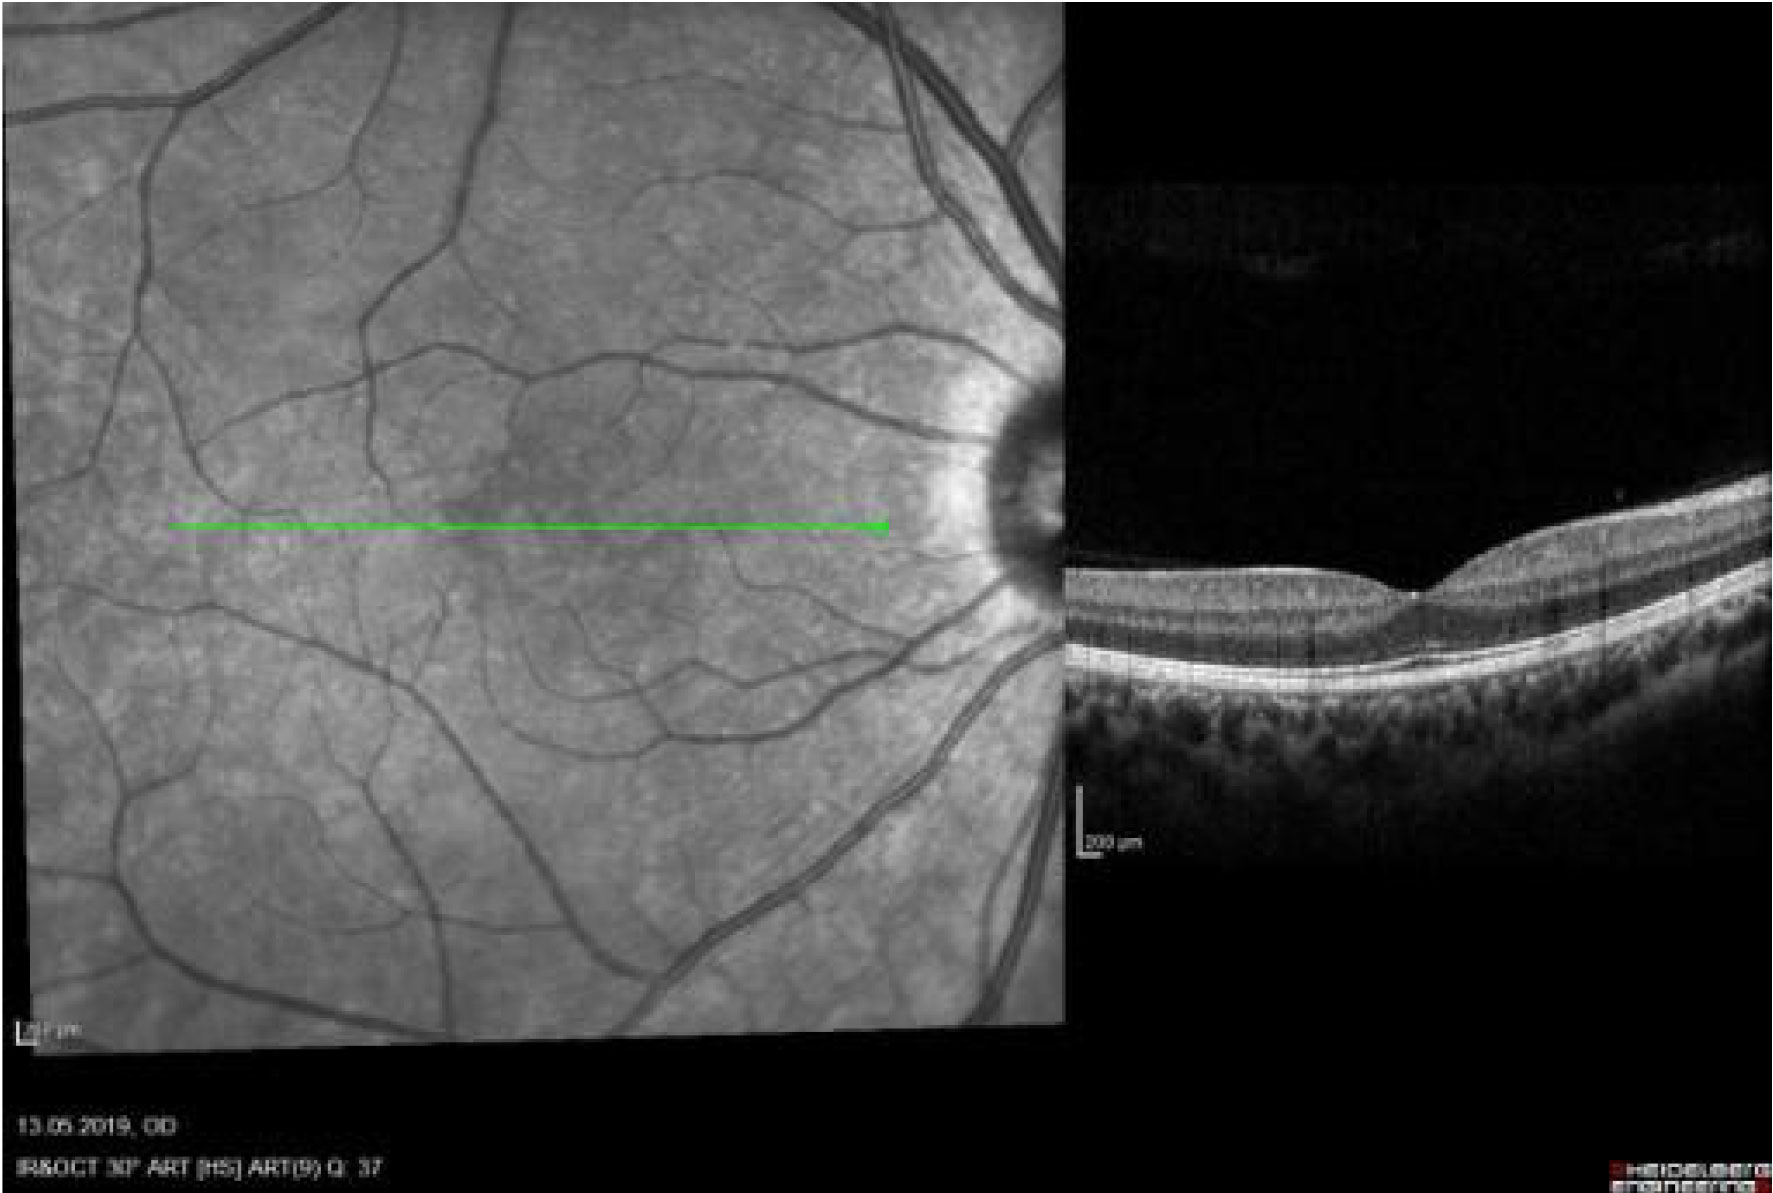
Fig. 5. Macula OCT scan, right eye: normal macular profile, structured retinal layers; no signs of clinical worsening have been revealed within the one month follow-up period
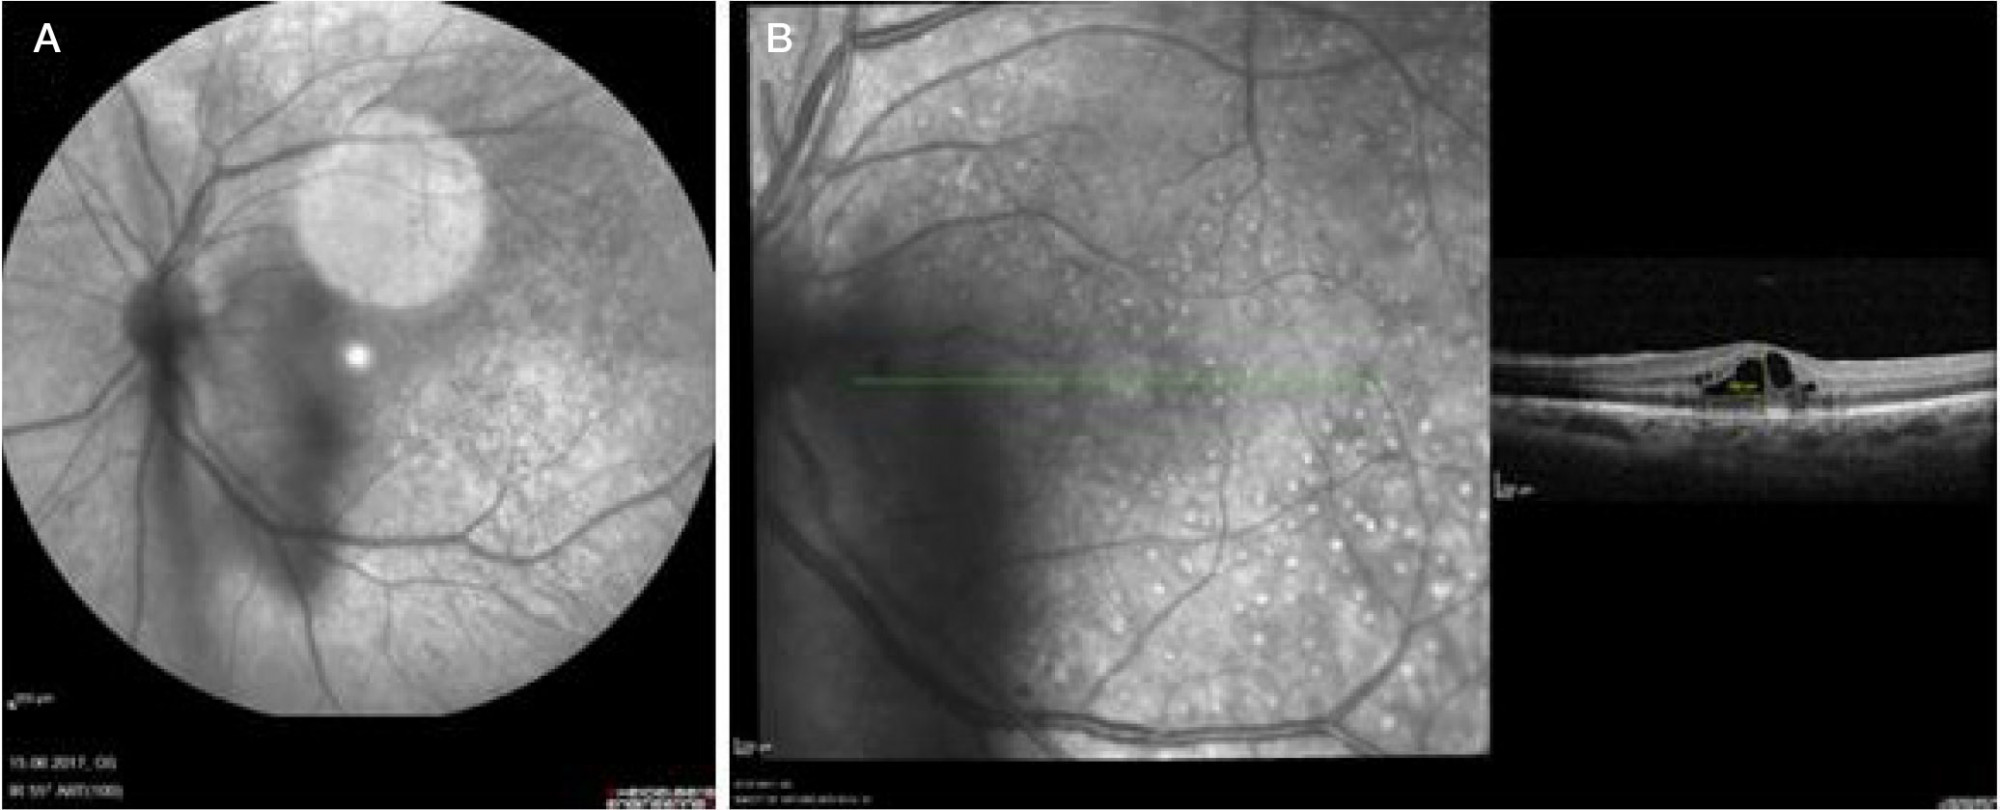
Fig. 6. А. IR reflectance image of fundus, left eye: declined hemophtalmos detected during a one month follow-up visit. B. Macula OCT scan, left eye: macular edema reduced from 600 to 500 μm
Fig. 7. Macula OCT scan, right eye: normal macular profile, structured retinal layers; no signs of clinical worsening have been revealed during the 2-year follow-up period
Fig. 8. А. Macula OCT scan, left eye: regression of cystoid macular edema, restored anatomic structure of retinal layers. B. Optic disc OCT, left eye: persisting fibrous cord over the optic disc (yellow arrow)
Fig. 9. IR — reflectance image of fundus, left eye: fibrotic neovascularization focus with sharp margins visualized in the clock hour sector 5 of peripheral retina (yellow arrow)