ORIGINAL RESEARCH

Metabolic “footprints” of the circulating cancer mucins: CA125 in the high-grade ovarian cancer

Chagovets VV1, Vasil'ev VG2, Iurova MV1,3, Khabas GN1, Pavlovich SV1,3, Starodubtseva NL1, Mayboroda OA4,5
About authors

1 Kulakov National Medical Research Center for Obstetrics, Gynecology and Perinatology, Moscow, Russia

2 Peoples’ Friendship University of Russia, Moscow, Russia

3 Sechenov First Moscow State Medical University, Moscow, Russia

4 Leiden University Medical Center, Leiden, The Netherlands

5 Tomsk State University, Tomsk, Russia

Correspondence should be addressed: Vitaly V. Chagovets
Akademika Oparina, 4, Moscow, 117997, Russia; moc.liamg@stevogahcvv

About paper

Funding: the study was supported by a grant from the Russian Science Foundation (project #20-65-46014).

Author contribution: Chagovets VV — study planning, sample preparation, discussion of NMR data processing, manuscript authoring and editing; Vasil'ev VG — sample preparation, NMR analysis; Iurova MV, Khabas GN — collection and characterization of clinical samples, discussion of the results; Pavlovich SV — study research, discussion of the results; Starodubtseva NL — study planning, clinical data processing; Mayboroda OA — study planning and management, manuscript authoring, NMR data processing.

Compliance with ethical standards: the study was approved by the Ethics Committee of the V.I. Kulakov National Medical Research Center for Obstetrics, Gynecology and Perinatology (Minutes #10 of December 05, 2019), conducted in accordance with federal laws of the Russian Federation (#152, 323 etc.) and the Declaration of Helsinki of 1964 with all subsequent extensions and amendments regulating scientific research involving biomaterials obtained from human beings.

Received: 2021-12-01 Accepted: 2021-12-16 Published online: 2021-12-29
|
Fig. 1. CA125 levels histogram. A. baseline and logarithmic levels. B. The dark red line indicates the median and the blue line indicates the mean of the distribution
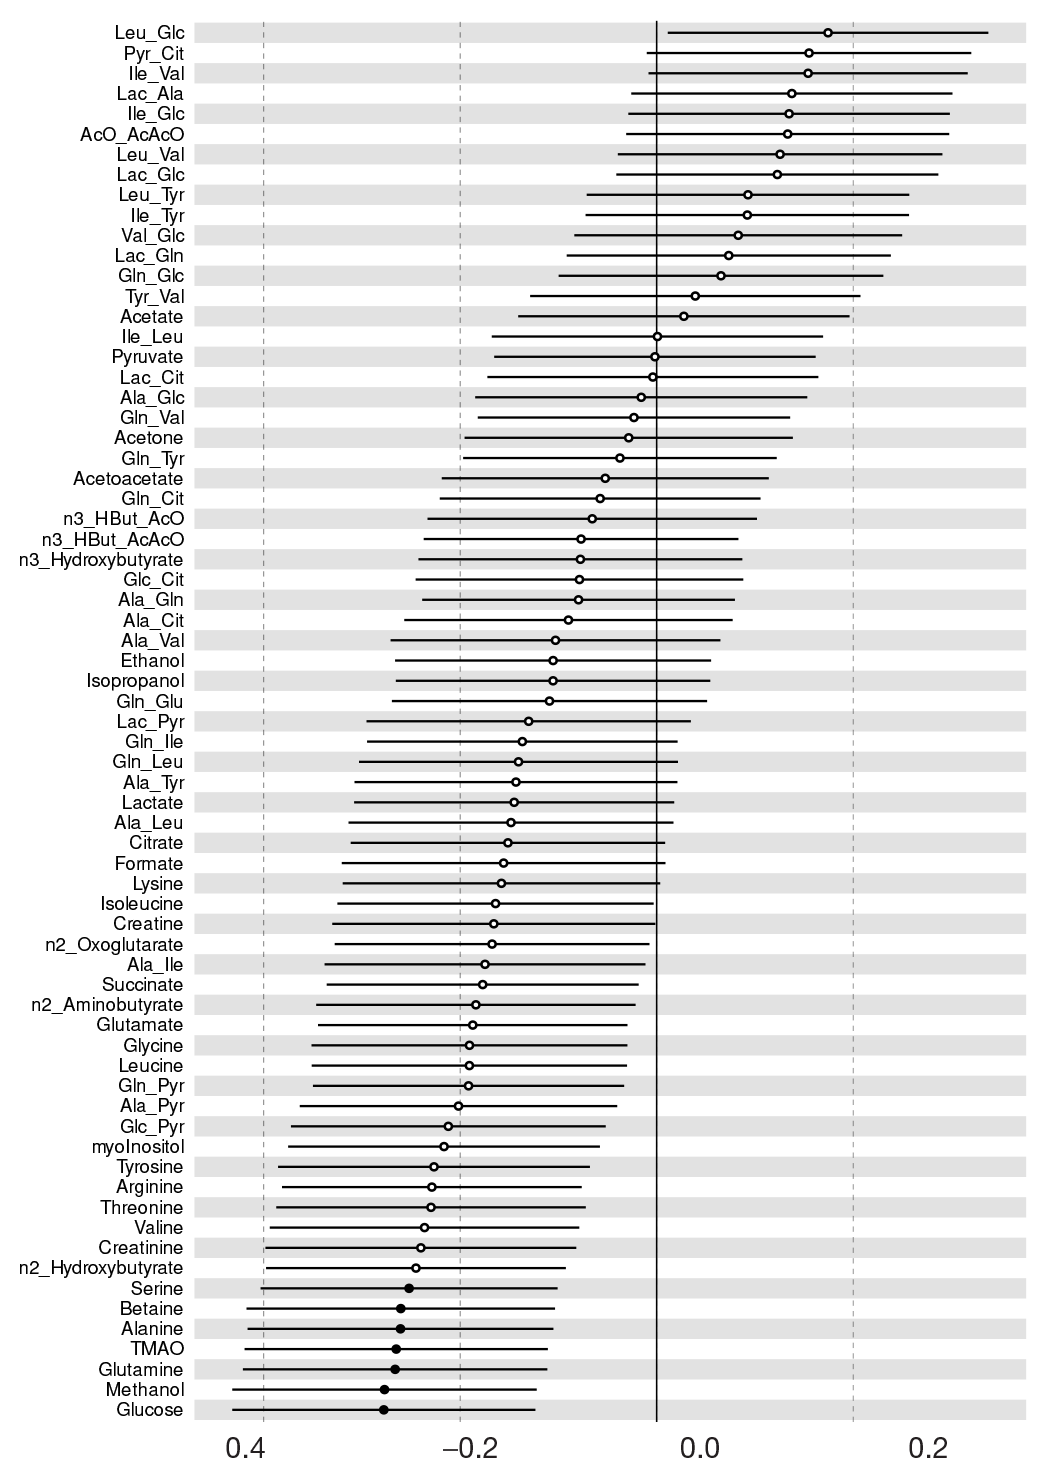
Fig. 2. Forest diagram summarizing all calculated regression models. The models are sorted by their standardized ratios (x-axis). Statistically significant (after adjustment for multiple testing) models are highlighted (filled dots)
Fig. 3. Scatter plots with regression lines illustrating statistically significant dependences of CA125 on metabolite concentrations
Table 1. Age and BMI of the patients with I–II and III–IV stages of HG OC (no statistically significant differences found; the method used is the Mann–Whitney U-test)
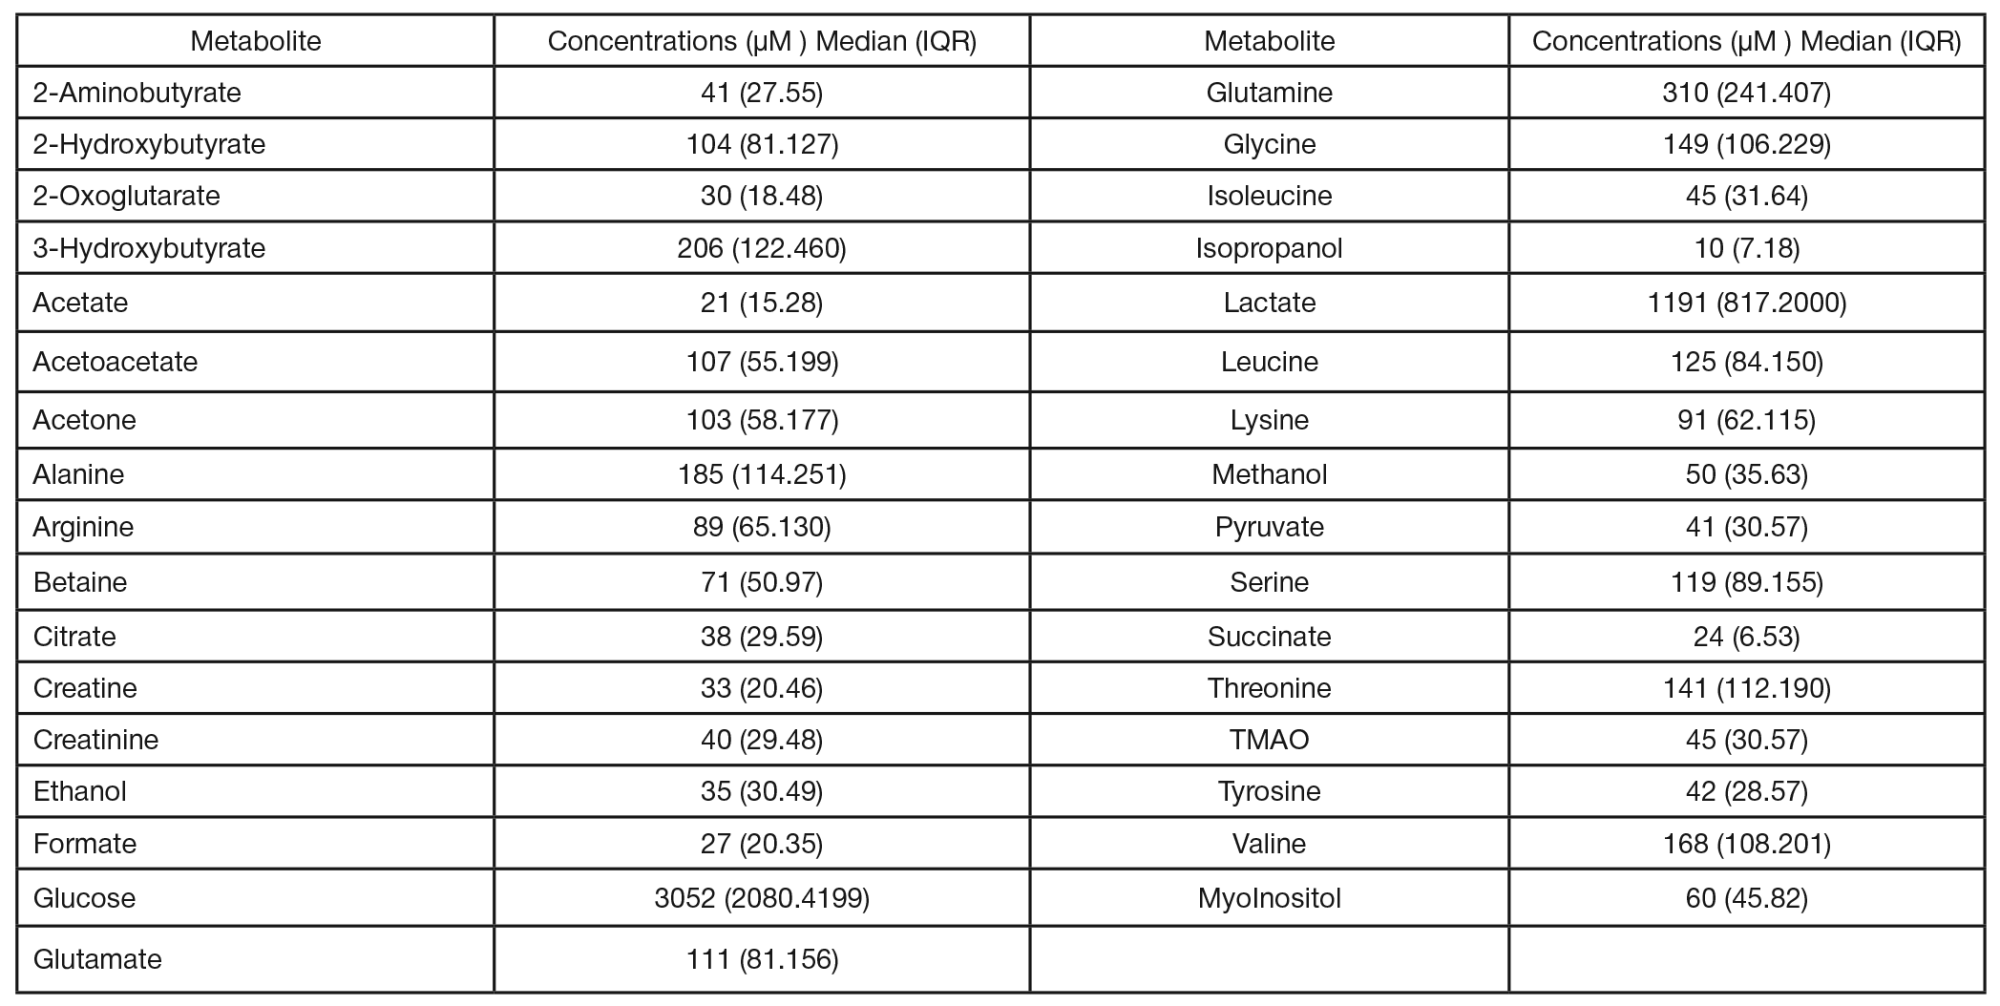
Table 2. List of quantified metabolites in plasma of patients with HG OC. The values are given as median/interquartile range and rounded to the nearest whole number
Note: IQR — Interquartile Range.
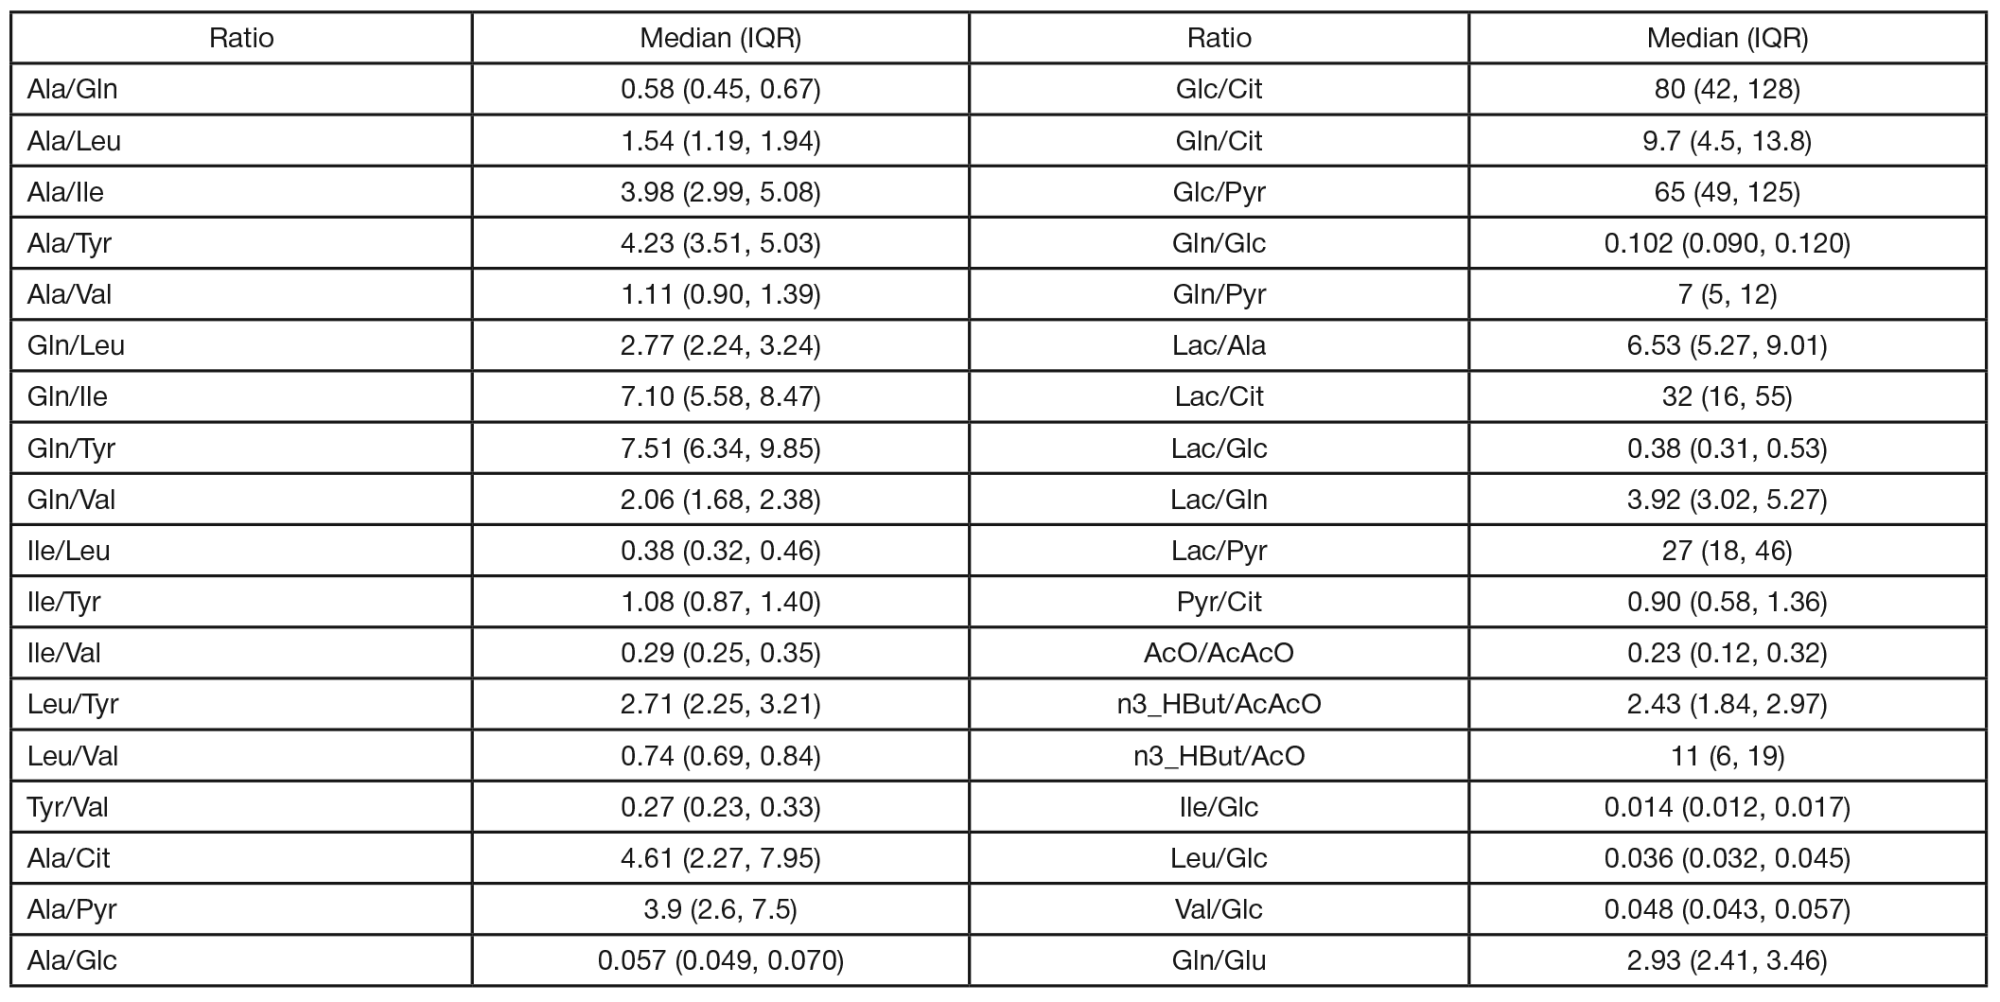
Table 3. Summary of the calculated metabolite relationships. The values are given as median/interquartile range
Note: Ala/Gln — alanine/glutamine, Ala/Leu — alanine/leucine, Ala/Ile — alanine/isoleucine, Ala/Tyr — alanine/tyrosine, Ala/Val — alanine/valine, Gln/Leu —glutamine/ leucine — glutamine/leucine/tyrosine, Gln/Val — glutamine/valine, Ile/Leu — isoleucine/leucine, Ile/Tyr — isoleucine/tyrosine, Ile/Val — isoleucine/valine, Leu/Tyr — leucine/tyrosine, Leu/Val — leucine/valine, Tyr/Val — tyrosine/valine, Ala/Pyr — alanine/pyruvate, Ala/Glc — alanine/glucose, Glc/Cit — glucose/citrate, Gln/Cit — glutamine/citrate, Glc/Pyr — glucose/pyruvate, Gln/Glc — glutamine/glucose, Gln/Pyr — glutamine/ pyruvate, Lac/Ala — lactate/alanine, Lac/Cit — lactate/citrate, Lac/Glc — lactate/glucose, Lac/Gln — lactate/glutamine, Lac/Pyr — lactate/pyruvate, Pyr/Cit — pyruvate/citrate, AcO/AcAcO — acetate/acetoacetic acid, n3_Hbut/ AcAcO — n3_Hydroxybutyrate/acetoacetic acid, n3_Hbut/AcO — n3_Hydroxyglucine/acetate, Ile/Glc — isoleucine/glucose, Leu/Glc — leucine/glucose, Val/Glc — valine/glucose, Gln/Glu — glutamine/glutamate.
Table 4. Summary of the regression models shown in Figure 3
Note: St. β St. — standardized β.