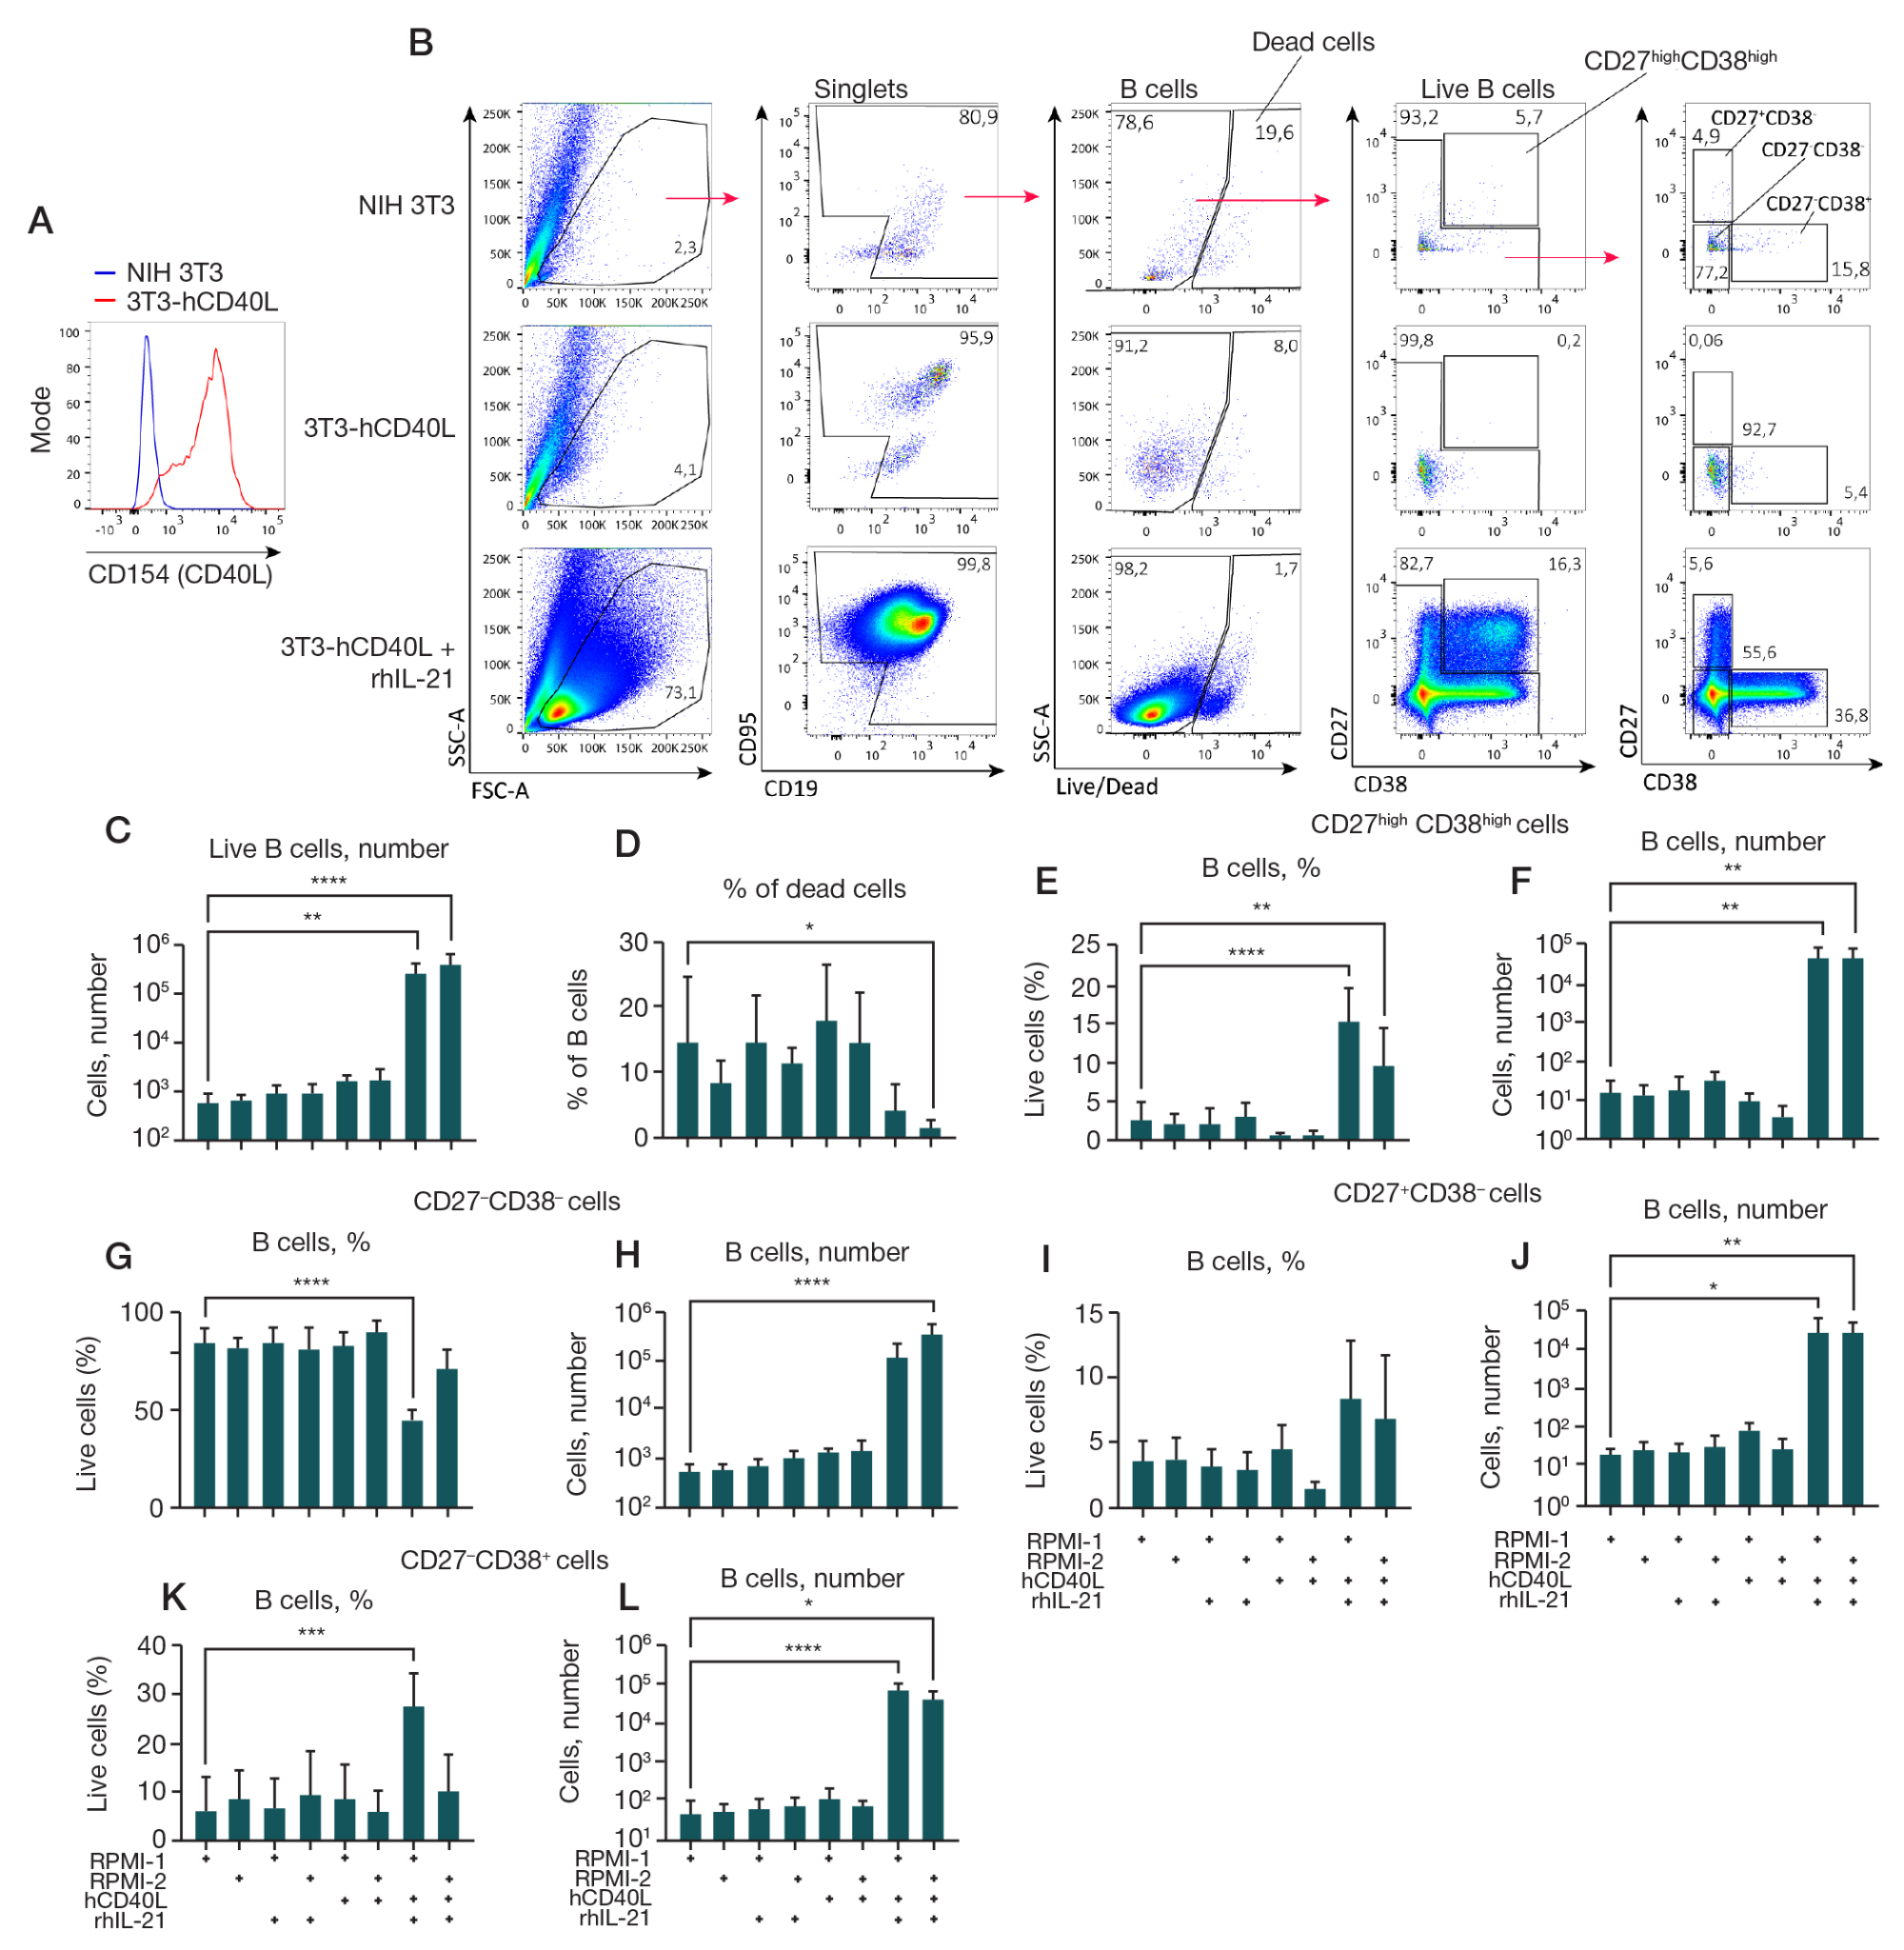
Fig. 1. Analysis of effect of a feeder line expressing rhCD40L, cytokine IL-21, and culture medium composition on the growth of B cell culture. The feeder line 3T3-hCD40L was obtained by transfecting the NIH 3T3 mouse fibroblast line with the pcDNA3.1-hCD40L plasmid to obtain a cell line stably expressing the transgene and subsequent selection of a monoclone with the highest level of hCD40L. 1.5 × 10⁴ (CD19+ CD20+) B cells obtained as a result of fluorescence sorting from human peripheral blood PBMCs were cultured on the feeder line 3T3-hCD40L with/without the addition of rhIL-21 (50 ng/ml) in two different culture media compositions (RPMI-1 and RPMI-2) for 7 days. Comparison was performed relative to B cells cultured in the presence of the untransfected NIH 3T3 feeder line. B cell cultures were analyzed by flow cytometry. A. Histogram of the distribution of the hCD40L (CD154) expression level on the surface of 3T3-hCD40L feeder cells (marked with a red line) compared with control untransfected NIH 3T3 fibroblasts (marked with a blue line). B. Representative graphs of the cytometric analysis. The gating strategy is indicated by arrows. C, D. The number of live B cells (C) and the percentage of dead B cells (D) in the cultures. E–L. Quantitative analysis of the percentage of live B cells and the total number of live B cells phenotypically divided by surface expression of CD27 and CD38 into CD27high CD38high — plasma cells and plasmablasts (E, F), CD27–CD38– (G, H), CD27+CD38– (I, J), and CD27–CD38+- B cells (K, L). The data is presented as the mean ± standard deviation (SD) for four independent experiments (n = 4), each experiment was performed in duplicate. Statistical analysis was performed by one-way analysis of variance (ANOVA) with Dunnett's correction for multiple comparisons, *, * *, * * *, * * * * — p ≤ 0.05; 0.001; 0.0001; 0.0001, respectively
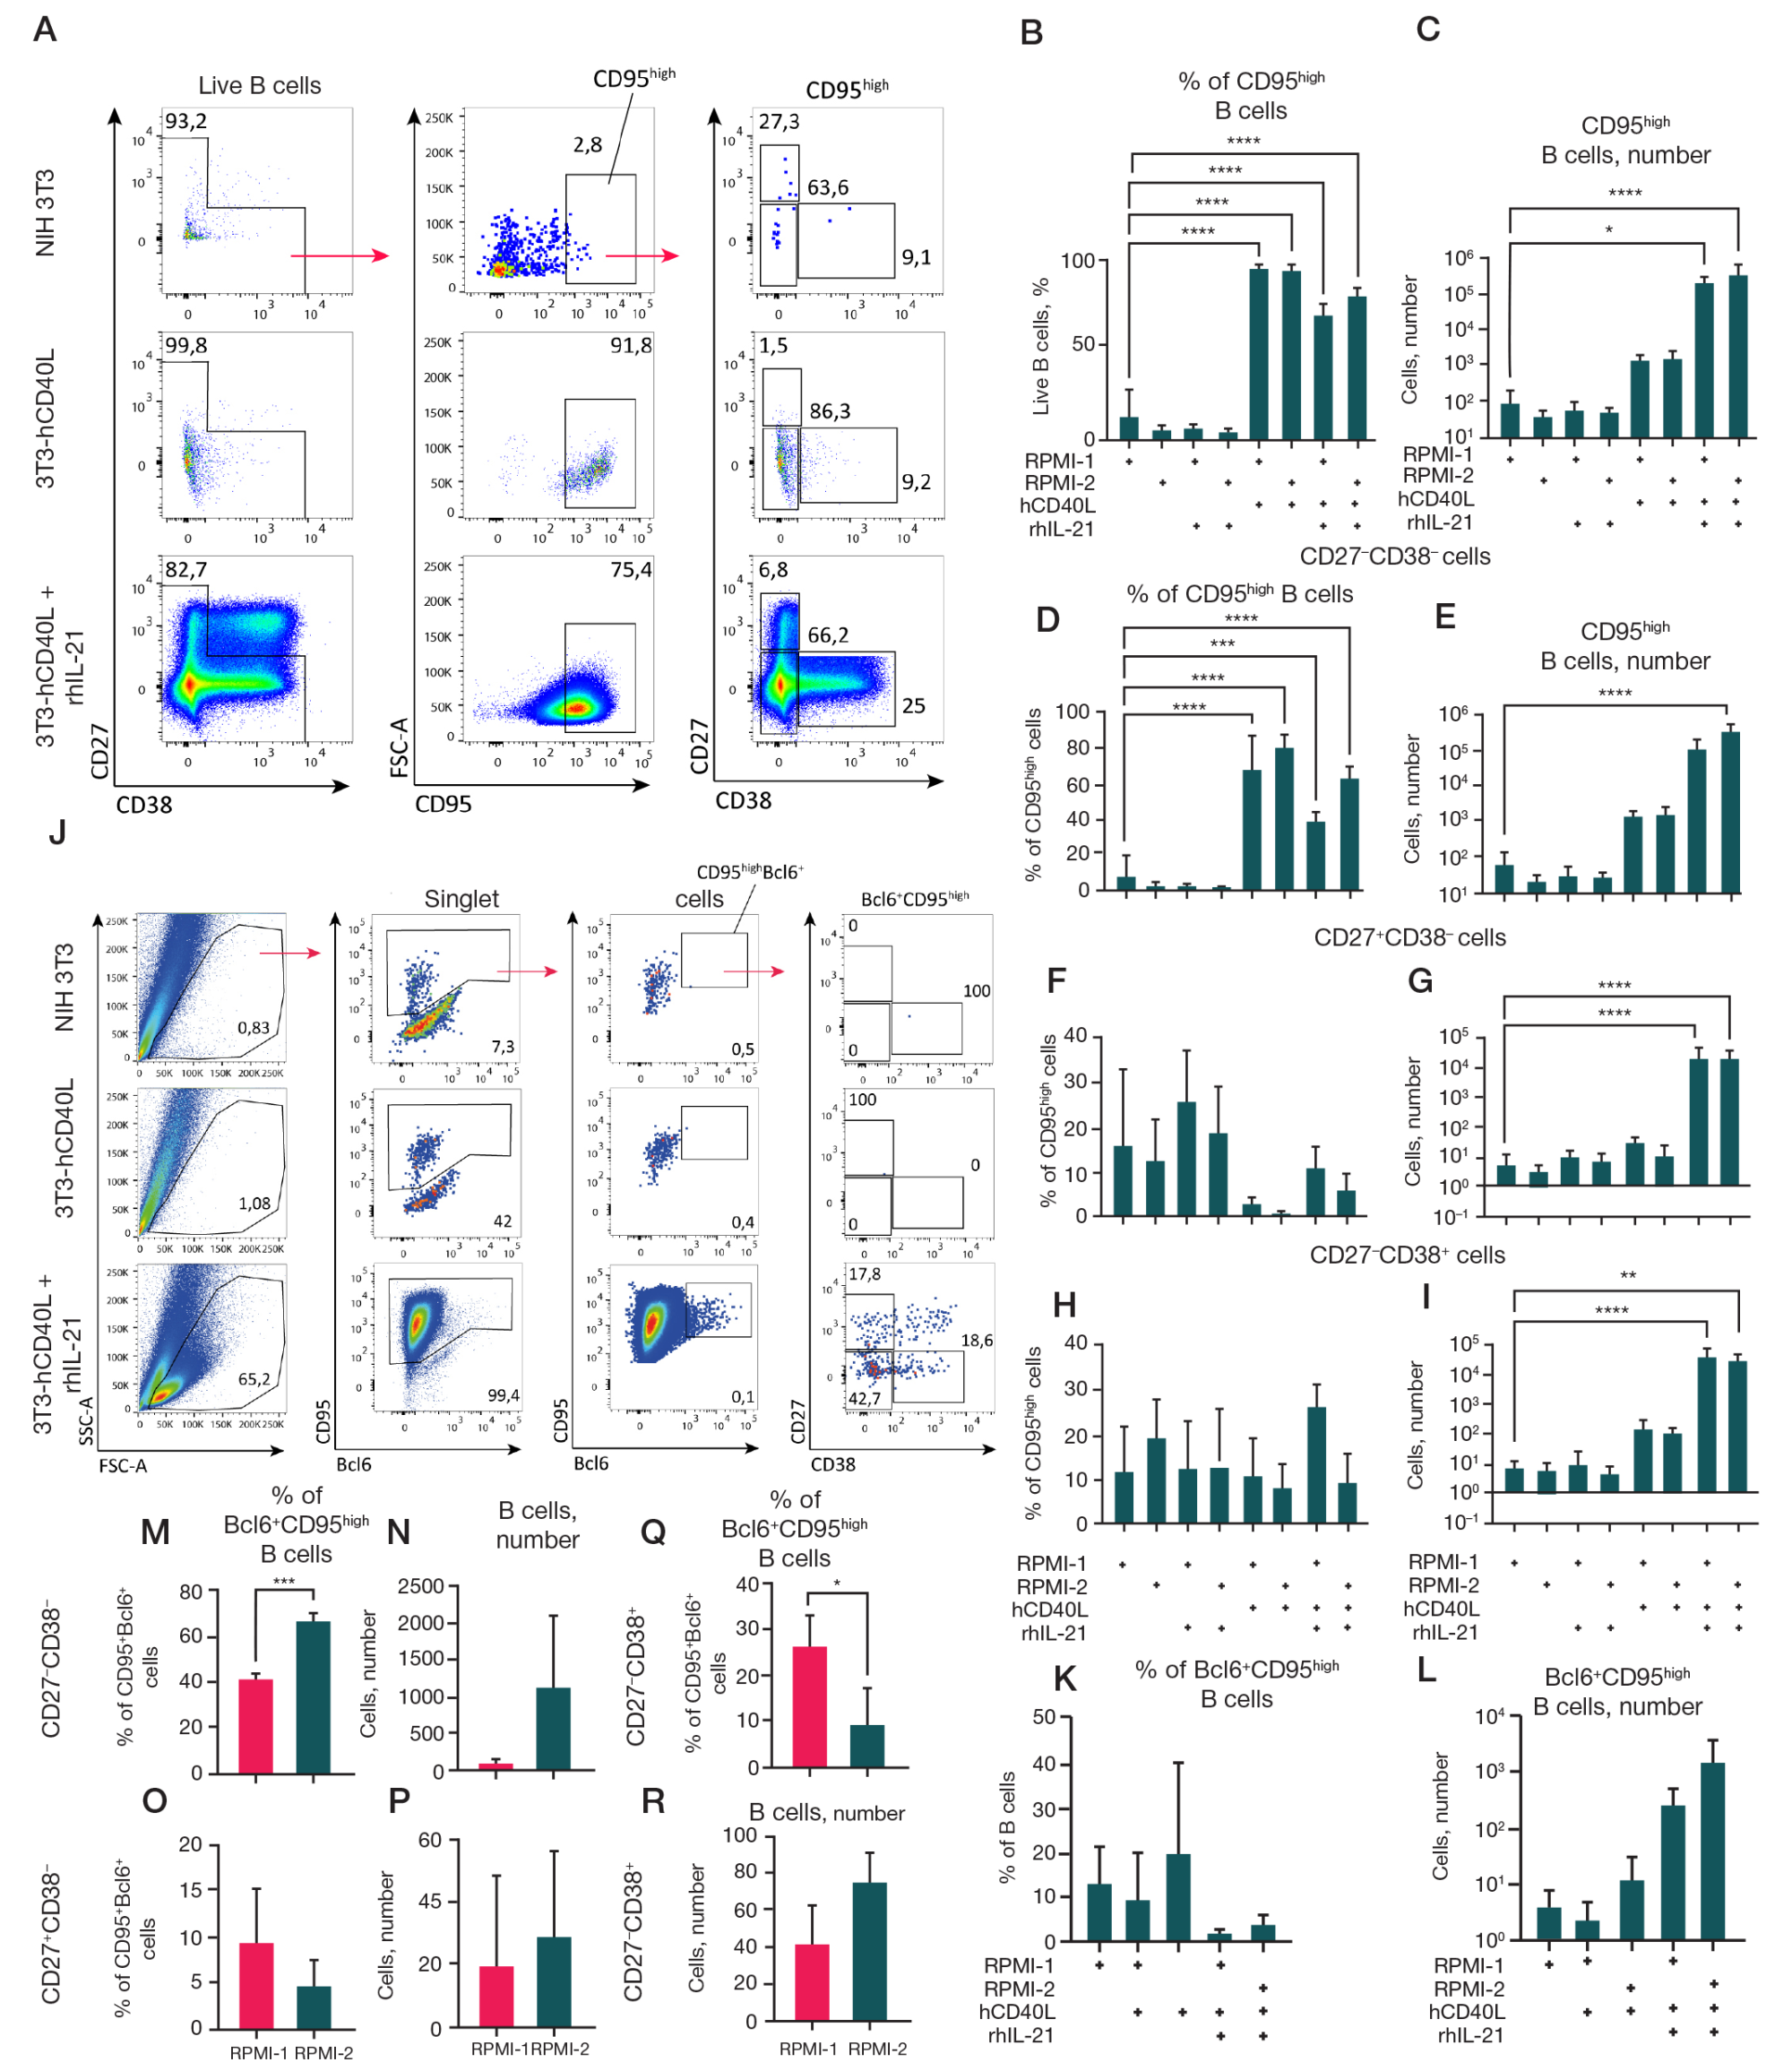
Fig. 2. Analysis of the effect of CD40L, IL-21, and cell culture medium composition on the surface expression of CD95 and intracellular expression of the transcription factor BCL6 in B-cell cultures. A–I. Analysis of the surface expression of CD95 and co-expression of CD27 and CD38 on B cells in cultures (excluding CD27high CD38high — plasma cells). Representative graphs of flow cytometry analysis. The gating strategy is indicated by arrows (A). Quantitative analysis of the percentage of (B) and absolute number (C) of CD95high -B cells in cultures. Quantitative analysis of the percentage of B cells and the absolute number of live CD95high -B cells for CD27–CD38– (D, E), CD27+CD38– (F, G), and CD27–CD38+ (H, I) B cells. J–R. B cells cultured in the presence of NIH 3T3 feeder line expressing hCD40L with or without rhIL-21 (50 ng/ml) in RPMI-1 or RPMI-2 were fixed and permeabilized for staining of the intracellular transcription factor BCL6. Comparison was made relative to B cells cultured in the presence of the untransfected NIH 3T3 line. Representative graphs of flow cytometry analysis of fixed B cells from the cultures. The gating strategy is indicated by arrows (J). Quantitative analysis of the BCL6+CD95high -B cells percentage (K) and absolute number (L) of the total number of B cells. Quantitative analysis of the percentage and absolute number of CD27–CD38– (M, N), CD27+CD38– (O, P) and CD27–CD38+ (Q, R) BCL6+CD95high B cells. The graphs present the data as the mean ± standard deviation (SD) for four independent experiments (n = 4), each experiment was performed in duplicate. Statistical analysis of CD95high B cell (B–I) and BCL6+CD95high B cell (K, L) subpopulations was performed by one-way analysis of variance (ANOVA) with Dunnett’s correction for multiple comparisons. Statistical analysis of BCL6+CD95high B cell (M–R) subpopulations was performed by unpaired T-test. *, * *, * * *, * * * * — p ≤ 0.05; 0.001; 0.0001; 0.0001 respectively
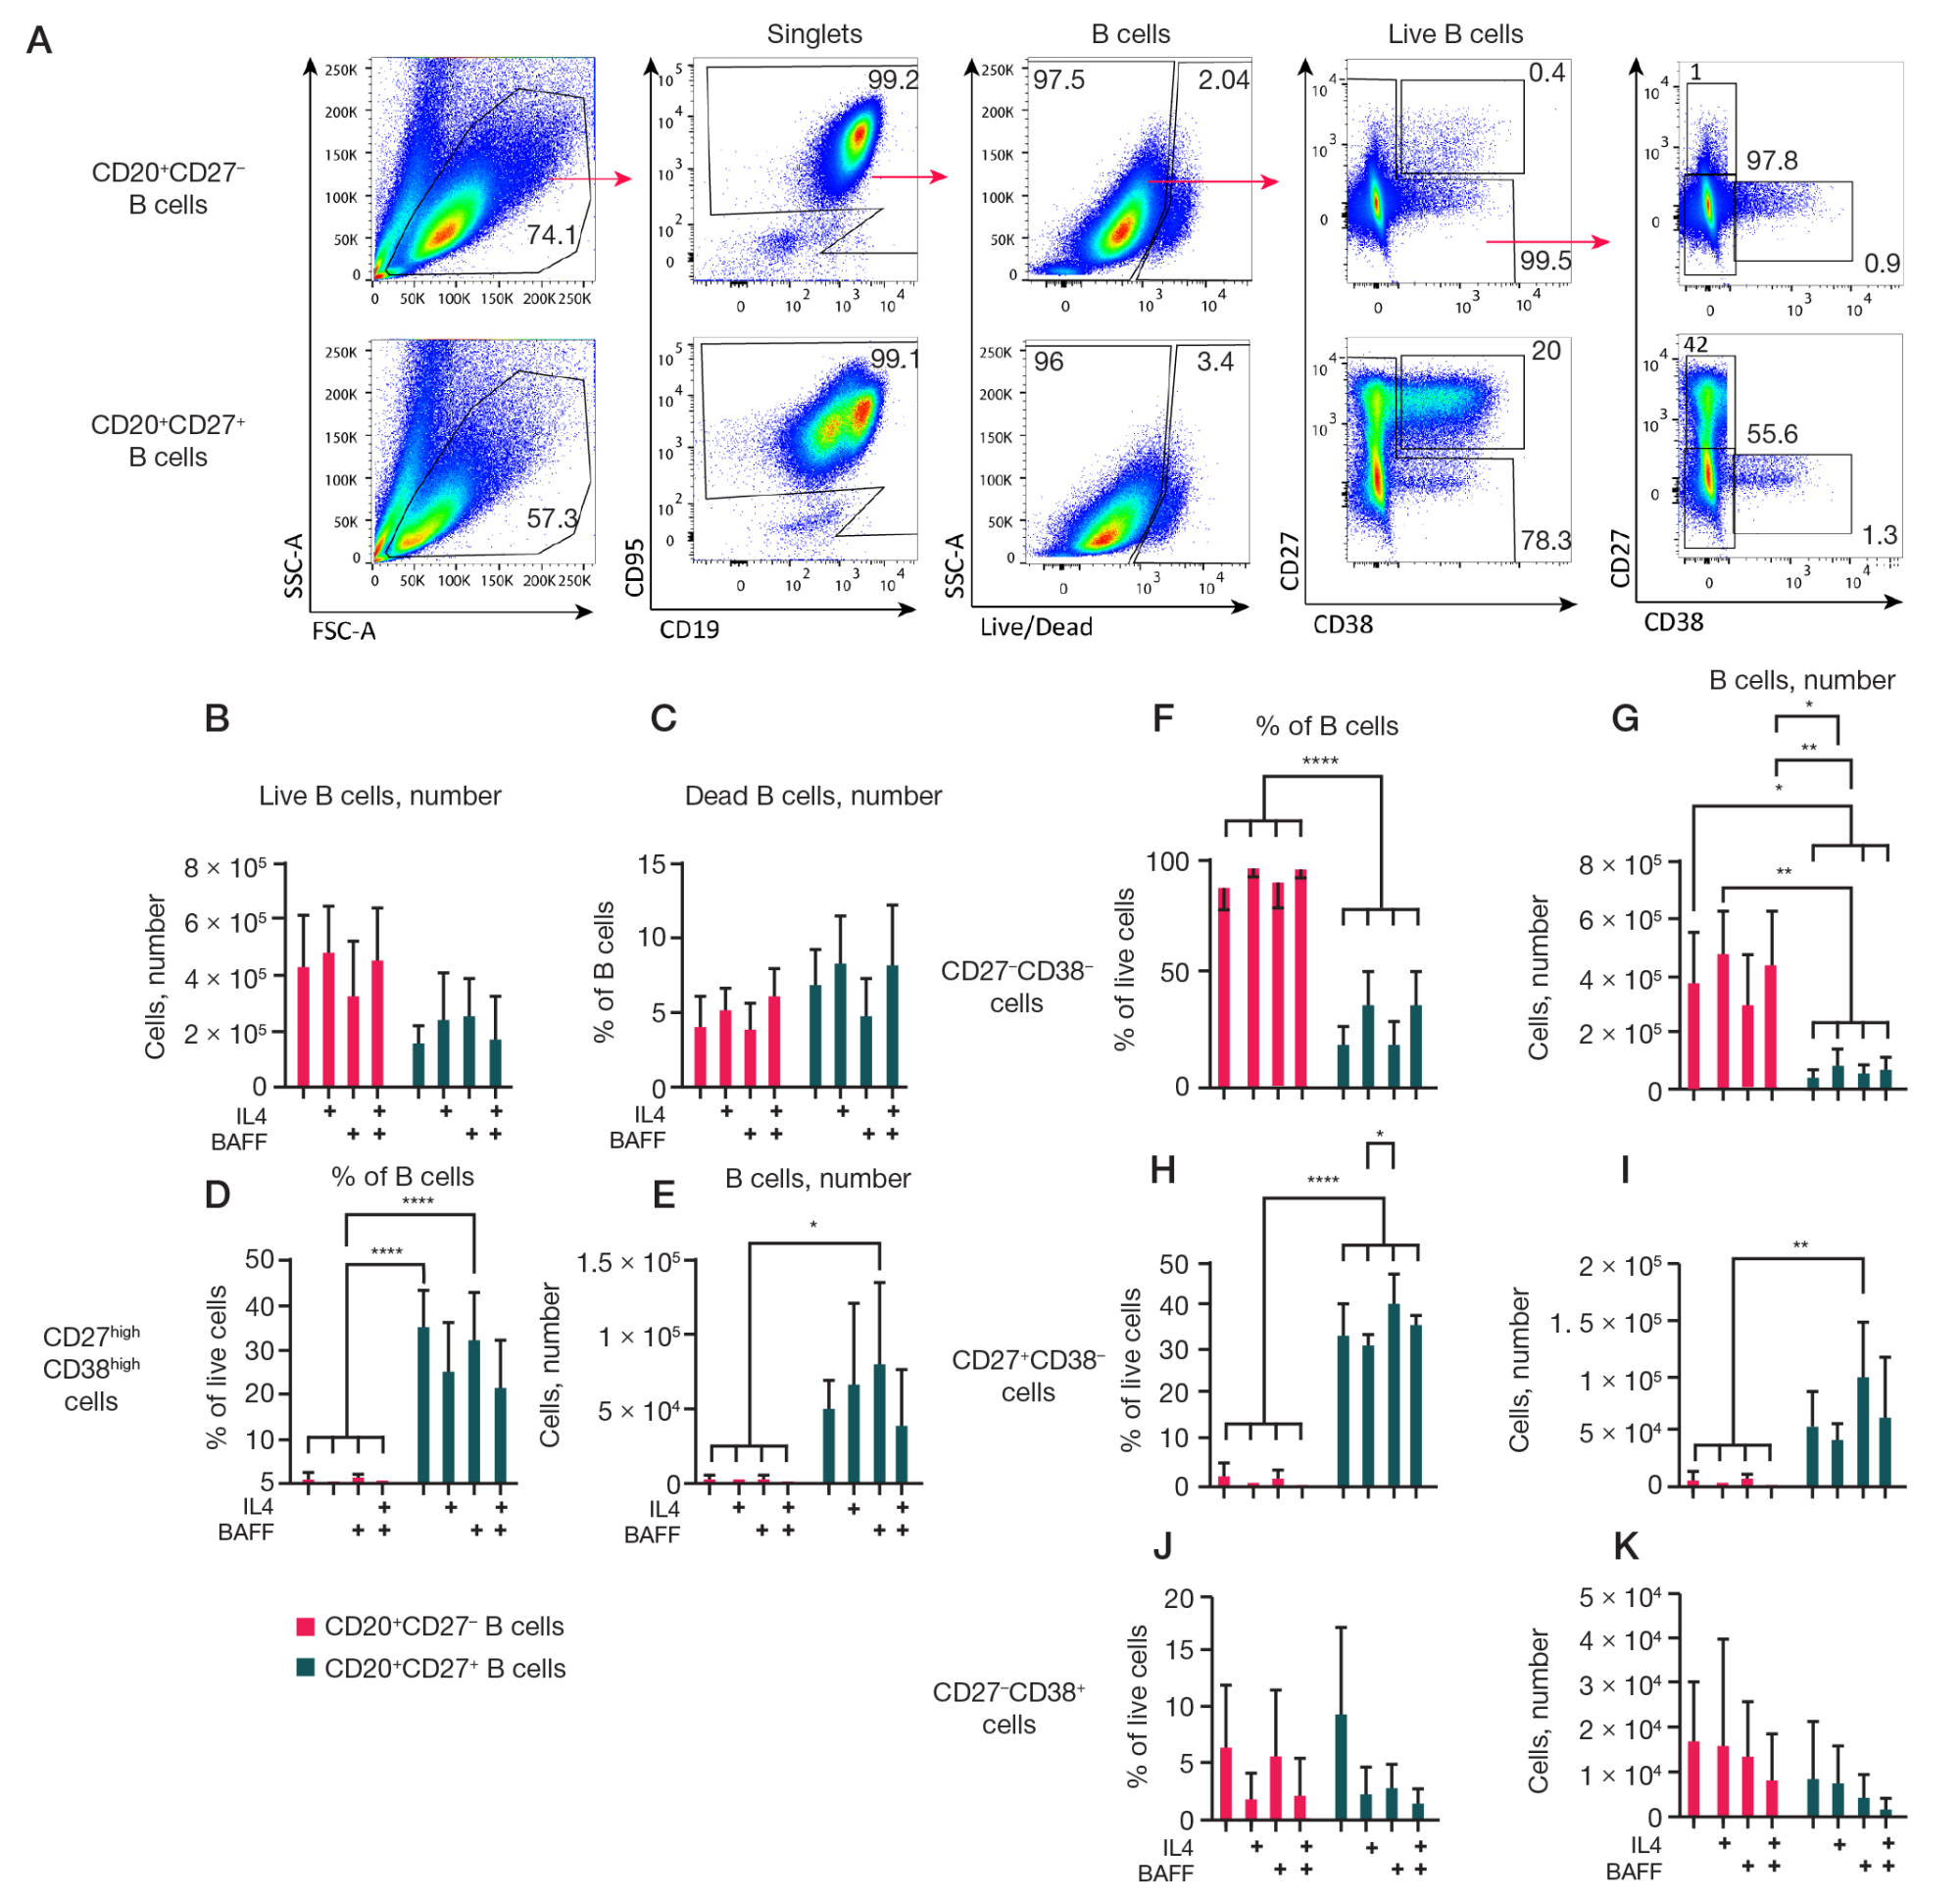
Fig. 3. Analysis of the effect of different cytokine compositions on CD27– and CD27+ memory B cell cultures. Predominantly naive B cells (CD19+CD20+CD27–) and memory B cells (CD19+CD20+CD27–) obtained from blood PBMC by FACS, at a concentration of 1.5 × 10⁴ were cultured on 3T3 feeder cells expressing hCD40L in RPMI-2 culture medium in the presence of rhIL-21 (50 ng/ml), with or without the addition of rhIL-4 (10 ng/ml) and rhBAFF (100 ng/ml) cytokines for 7 days. Cell cultures were analyzed by flow cytometry. A. Representative graphs of flow cytometry analysis. Arrows indicate the gating strategy. The number of live B cells (B) and the percentage of dead B cells (C) in cultures. Quantitative analysis of the percentage of live B cells and the absolute number of CD27highCD38high — plasma cells and plasmablasts (D, E), CD27–CD38– (F, G), CD27+CD38– (H, I), and CD27–CD38+ (J, K) B cells. The graphs present the data as the mean ± standard deviation (SD) for four independent experiments (n = 4), each experiment was performed in duplicate. Statistical analysis was performed by two-way analysis of variance (ANOVA) with Tukey's test for multiple comparisons, *, * *, * * *, * * * * — p ≤ 0.05; 0.001; 0.0001; 0.0001, respectively
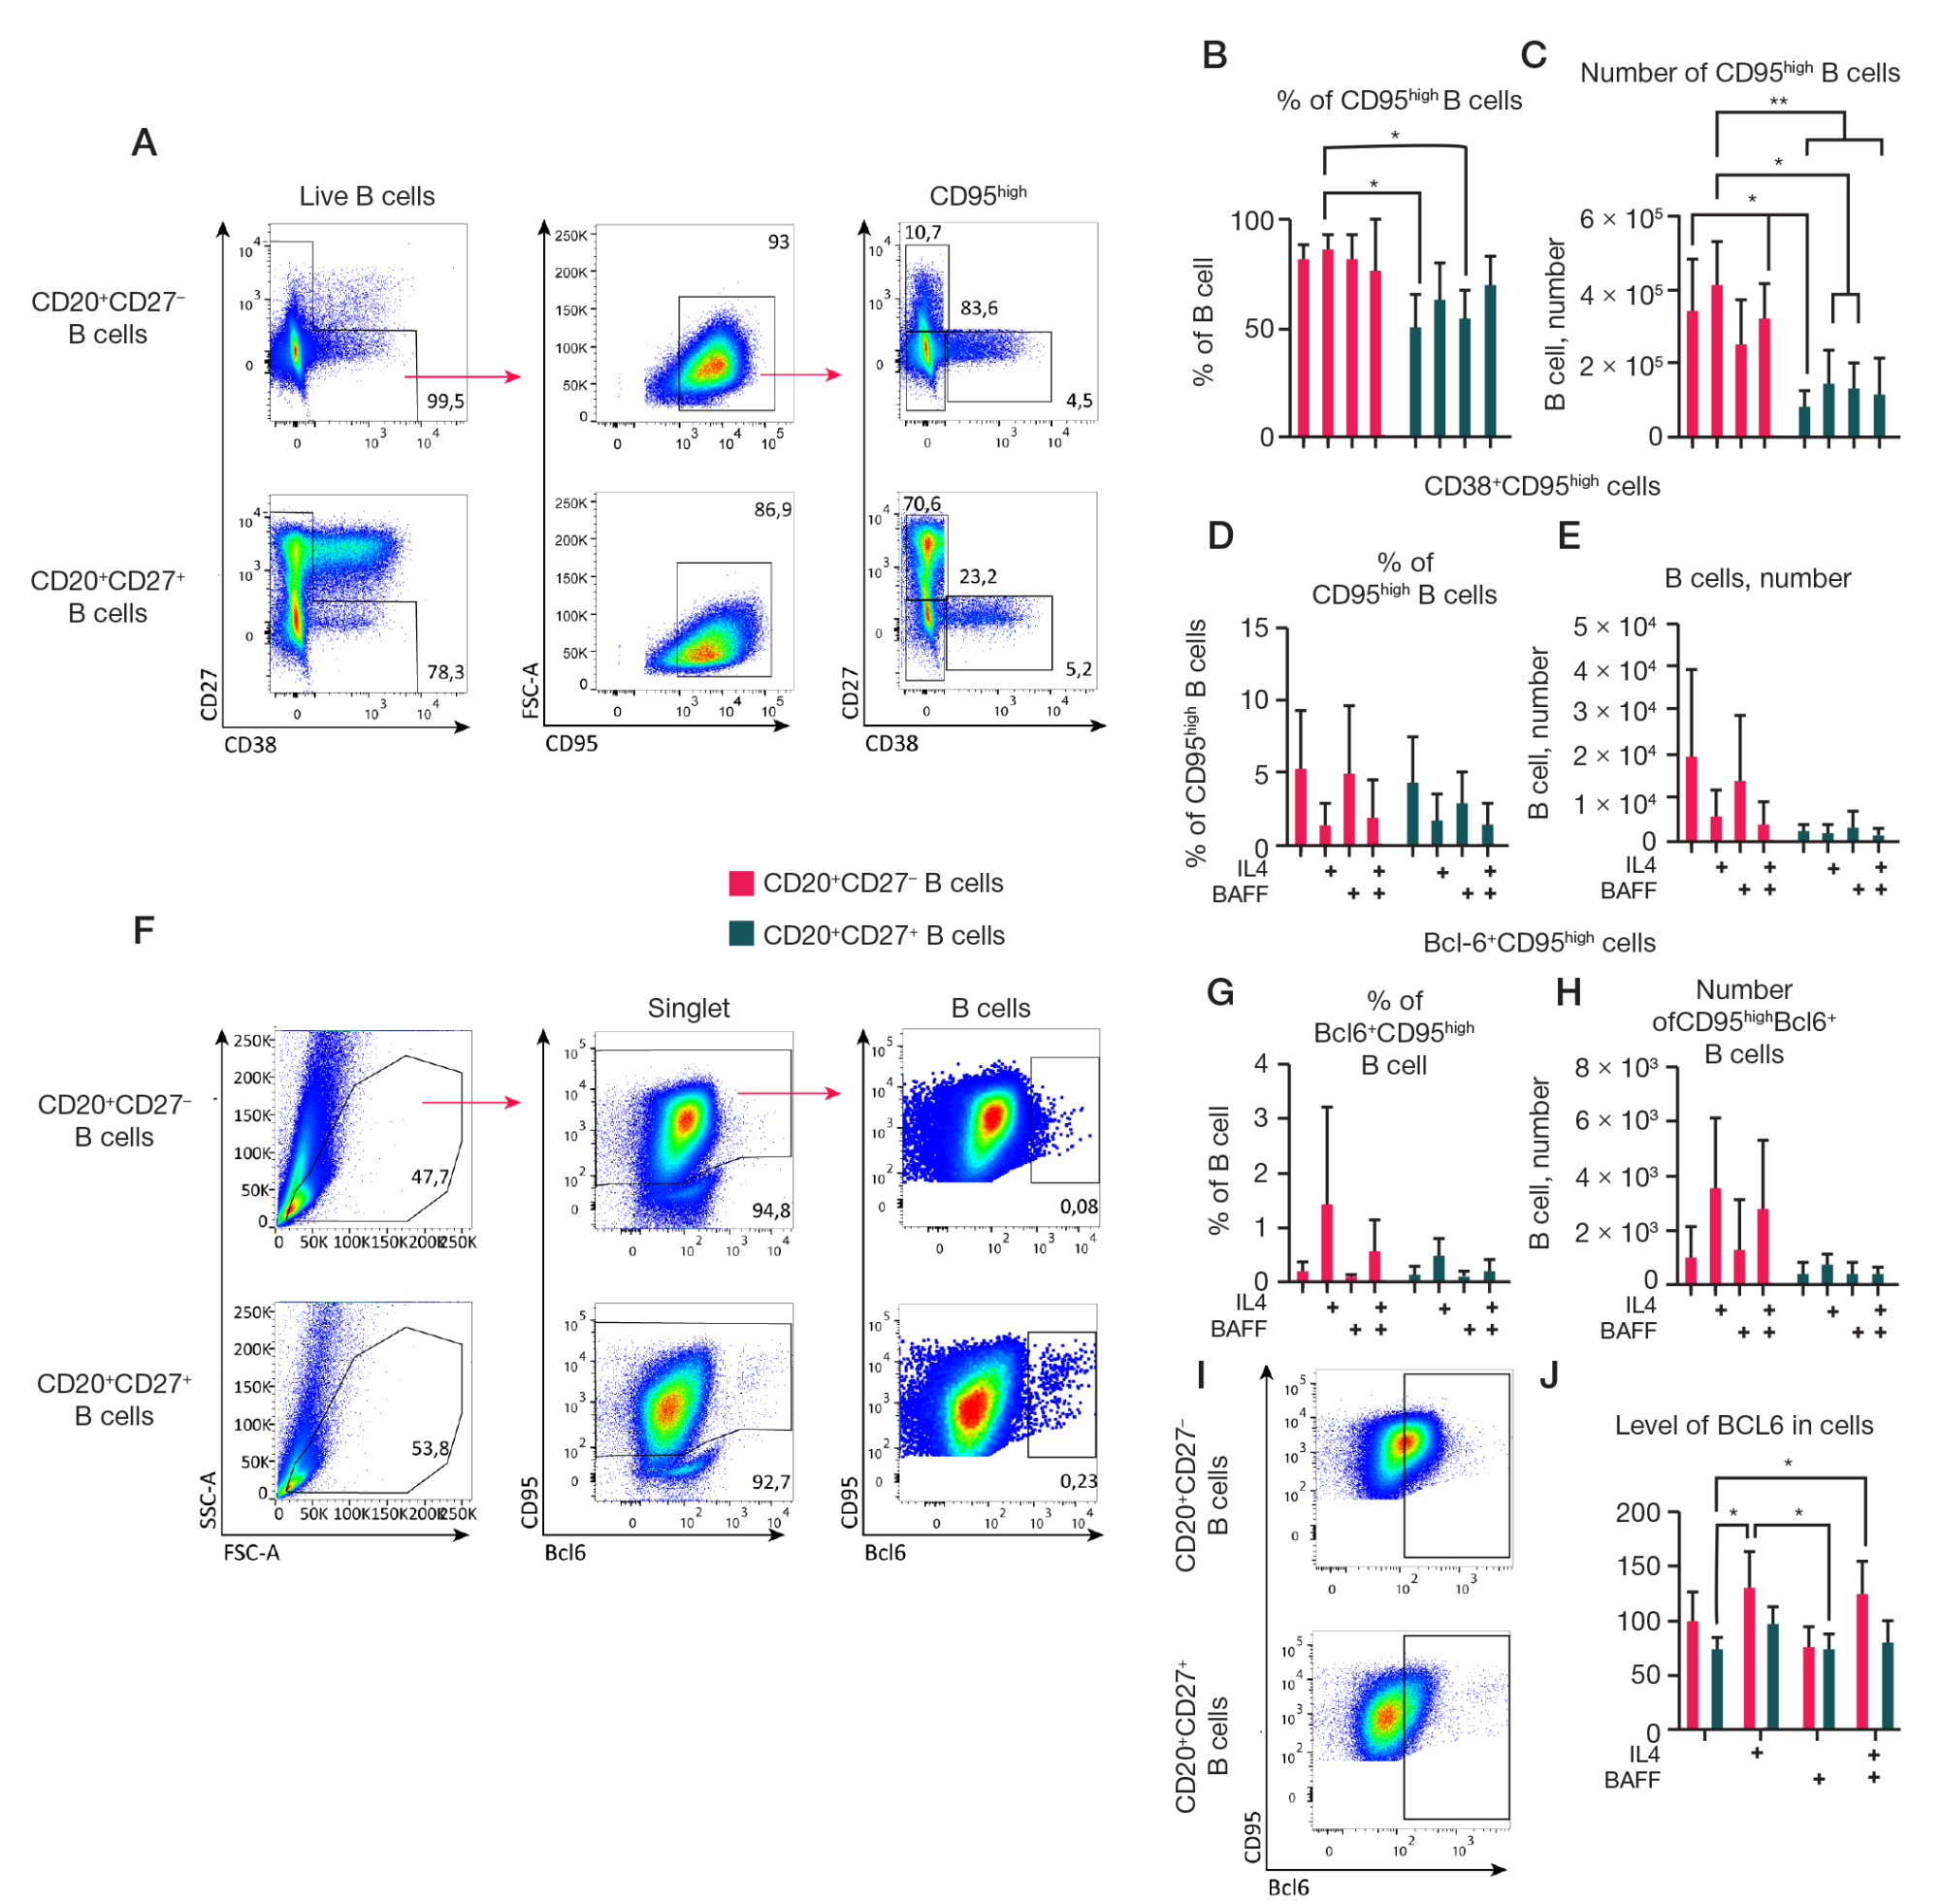
Fig. 4. Analysis of the effect of different cytokine compositions on the surface expression of CD95 and intracellular expression of the transcription factor BCL6 on cultures of CD27– B cells and CD27+ memory B cells. 1.5 × 10⁴ CD19+CD20+CD27– and CD19+CD20+CD27– B cells were cultured on 3T3 feeder cells expressing hCD40L in RPMI-2 culture medium in the presence of rhIL-21 (50 ng/ml), with or without the addition of the cytokines rhIL-4 (10 ng/ml) and rhBAFF (100 ng/ml) for 7 days. A–E. Analysis of CD95 surface expression and CD27 and CD38 co-expression on B cells in cultures (excluding CD27high CD38high plasma cells). Representative graphs of flow cytometry analysis of CD95 surface expression. The gating strategy is indicated by arrows (A). Quantitative analysis of the percentage of live B cells (B) and the absolute number (C) of live CD95high B cells in cultures. Quantitative analysis of the percentage of CD95high B cells (D) and the absolute number of live CD38+CD95high B cells (E). F–J. Analysis of intracellular BCL6 expression in cell cultures. For this, cells from the cultures were fixed and permeabilized for staining of the intracellular transcription factor BCL6. Representative graphs of flow cytometry analysis (F). The gating strategy is indicated by arrows. Percentage (G) of B cells and absolute number (H) of CD95high BCL6+ cells. Representative panels of cytometric analysis illustrating the distribution of BCL6 in cell cultures of CD20+CD27+ and CD20+CD27– B cells (I). Mean fluorescence intensity (MFI) of the transcription factor BCL6 in cells from cultures (J). Quantitative analysis data are presented as the mean ± standard deviation (SD) for four independent experiments (n = 4), each experiment was performed in duplicate. Statistical analysis was performed by two-way analysis of variance (ANOVA) using Tukey's multiple comparison test, *, * *, * * *, * * * * — p ≤ 0.05; 0.001; 0.0001; 0.0001, respectively
Table 1. Experimental design for optimizing CD19+CD20+ B cell culture conditions

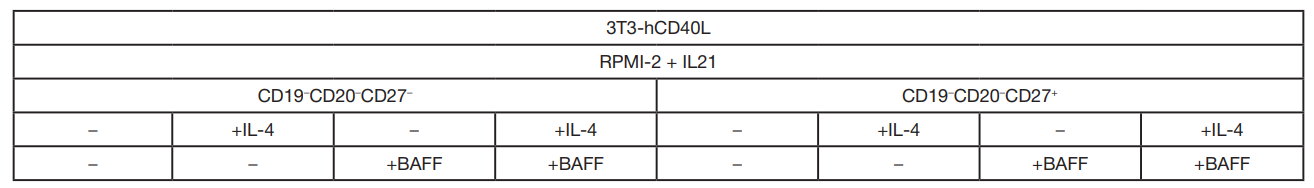
Table 2. Experimental design for studying cultures of CD20+CD27– naive B cells and CD20+CD27+ memory B cells