Copyright: © 2025 by the authors. Licensee: Pirogov University.
This article is an open access article distributed under the terms and conditions of the Creative Commons Attribution license (CC BY).

ORIGINAL RESEARCH

Panel of IFN-I-induced genes in systemic scleroderma: a stratification biomarker potential

Shagina IA1,2,5, Turchaninova MA2,5, Golovina OA3, Bufeeva LS2,5, Zhurina TI3, Saifullin RF1,4, Myshkin MYu2,5, Mutovina ZYu3, Britanova OV2,5
About authors

1 Pirogov Russian National Research Medical University, Moscow, Russia

2 MyLaboratory LLC, Moscow, Russia

3 Moscow City Research Center Hospital No. 52, Moscow, Russia

4 Federal Scientific and Clinical Center of Resuscitation and Rehabilitation, Moscow, Russia

5 Shemyakin and Ovchinnikov Institute of Bioorganic Chemistry Russian Academy of Sciences, Moscow, Russia

Correspondence should be addressed: Olga V. Britanova
Miklukho-Maklaya, 16/10, Moscow, 117997, Russia; moc.liamg@natirblo; Zinaida Yu. Mutovina — Pekhotnaya, 3, Moscow, 123182, Russia, ur.liam@anivotumz

About paper

Funding: the study was supported by the grant from the Moscow Government (R&D project No. 1603-47/23 dated 08.06.2023), sponsored by the Moscow Center for Innovative Technologies in Healthcare.

Author contribution: Mutovina ZYu — concept; Zhurina TI, Saifullin RF — acquisition of rheumatology and medicine data; literature review; Myshkin MYu — data analysis; Bufeeva LS — sample collection, RNA extraction; Shagina IA — RT-qPCR optimization and procedure, primary data analysis, manuscript writing, literature review; Turchaninova MA, Golovina OA, Britanova OV — manuscript writing, literature review.

Compliance with ethical standards: the study was conducted in accordance with the Declaration of Helsinki. The informed consent for biomaterial collection and testing during inpatient assessment settings was obtained from all patients.
Received: 2025-09-06 Accepted: 2025-10-08 Published online: 2025-10-21
|
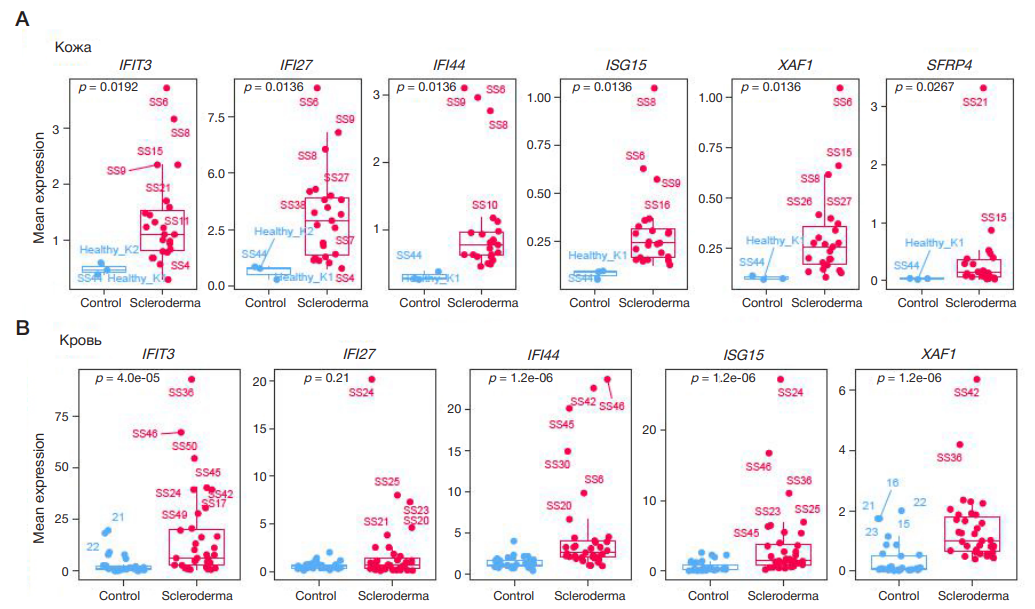
Fig. 1. Comparison of the test gene relative expression levels by RT-qPCR (p-value — based on the Mann–Whitney test) between skin samples in the groups of patients with SS (n = 23) and healthy donors (n = 3) (A), between peripheral blood samples in the groups of patients with SS (n = 35) and healthy donors (n = 31) (B)
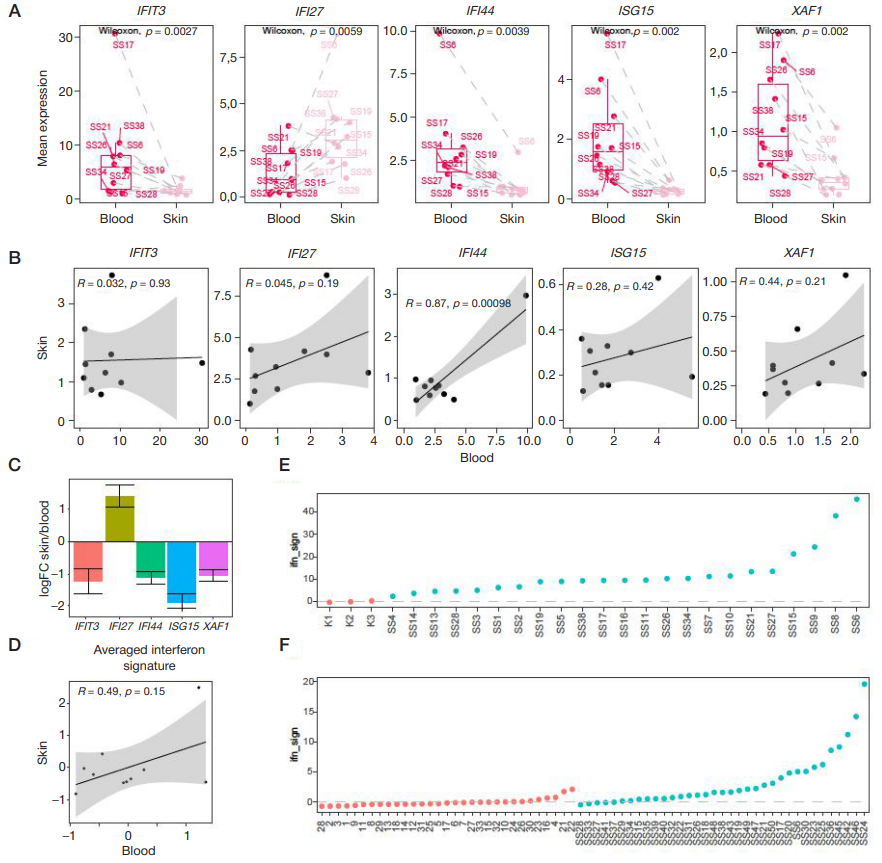
**Fig. 2**. Comparison of interferon signature in blood and skin of patients with SS. **А**. Comparison of relative expression levels of the test genes IFIT3, IFI27, IFI44, ISG15, XAF1 in the RNA samples obtained from the skin and peripheral blood of SS patients (n = 10) represented as a box-plot. The Wilcoxon signed-rank test was used. **B**. Pairwise correlation of the IFN-I panel gene expression between blood and skin. **C**. A bar chart shows the mean log fold change) for the skin and blood. Negative values indicate higher expression in blood, and positive values indicate higher expression in the skin. **D**. Correlation of the averaged IFN-I signature of blood and skin for paired samples (n = 10), (R = 0.49; p = 0.15). **B, D** Spearman’s rank correlation coefficient is used (grey areas — 95% CI). **E**. IFN-I signature values (z-score, standardized against donor values) in skin biopsy samples: red dots — healthy donors (n = 3), blue dots — SS patients (n = 23). F**. IFN-I signature values (z-score, standardization by healthy donors) in peripheral blood samples. Red dots — healthy donors (n = 31), blue dots — SS patients (n = 35, including 10 paired skin/blood samples). The dashed line shows the threshold interval
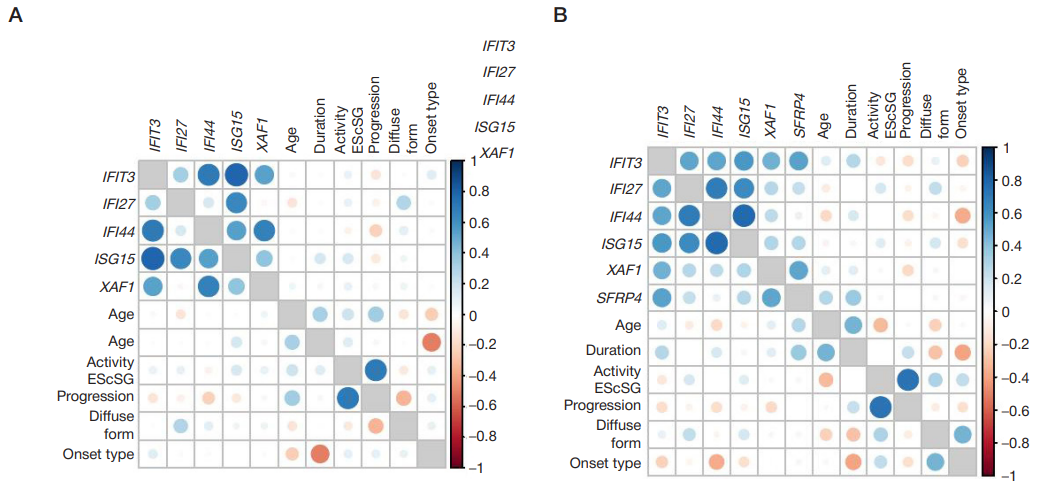
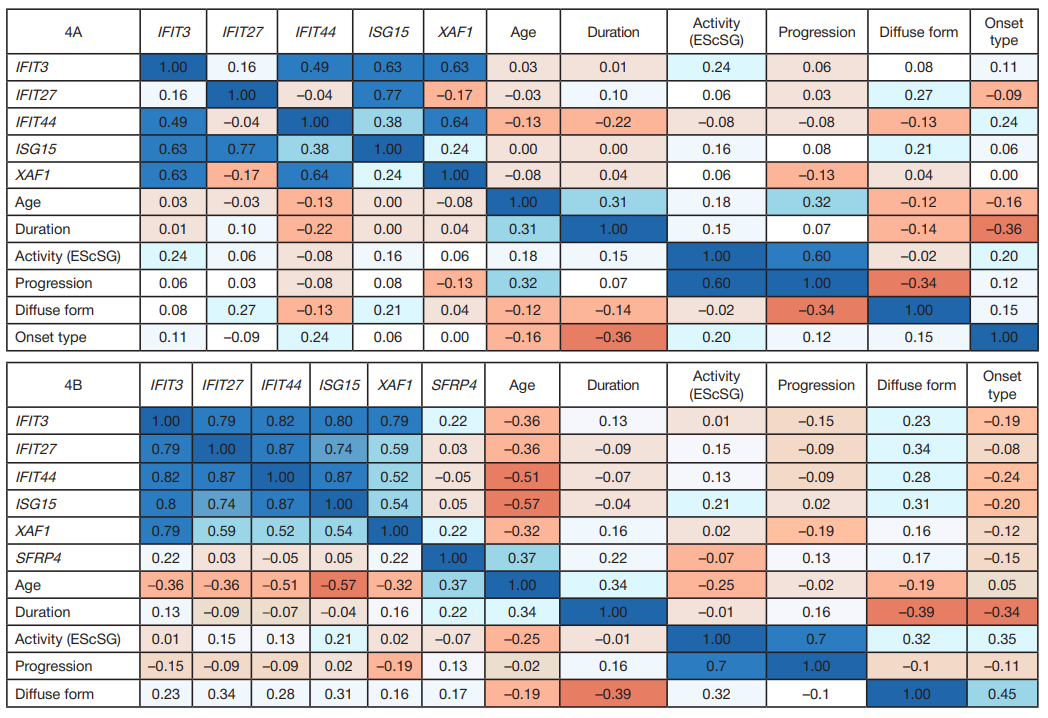
Fig. 3. Correlation matrix for expression levels of the IFN-I signature genes (IFI44, IFIT3, ISG15, IFI27, XAF1) in the samples and clinical signs of the group of SS patients for peripheral blood (n = 35) (A) and affected skin samples (n = 23) (B). The SFRP4 gene expression was added as a disease marker. The circle color indicates the correlation sign and strength: blue — positive, red — negative; the more saturated the color, the closer |r| to 1. The circle size is proportional to the Spearman’s rank correlation module (coefficient)
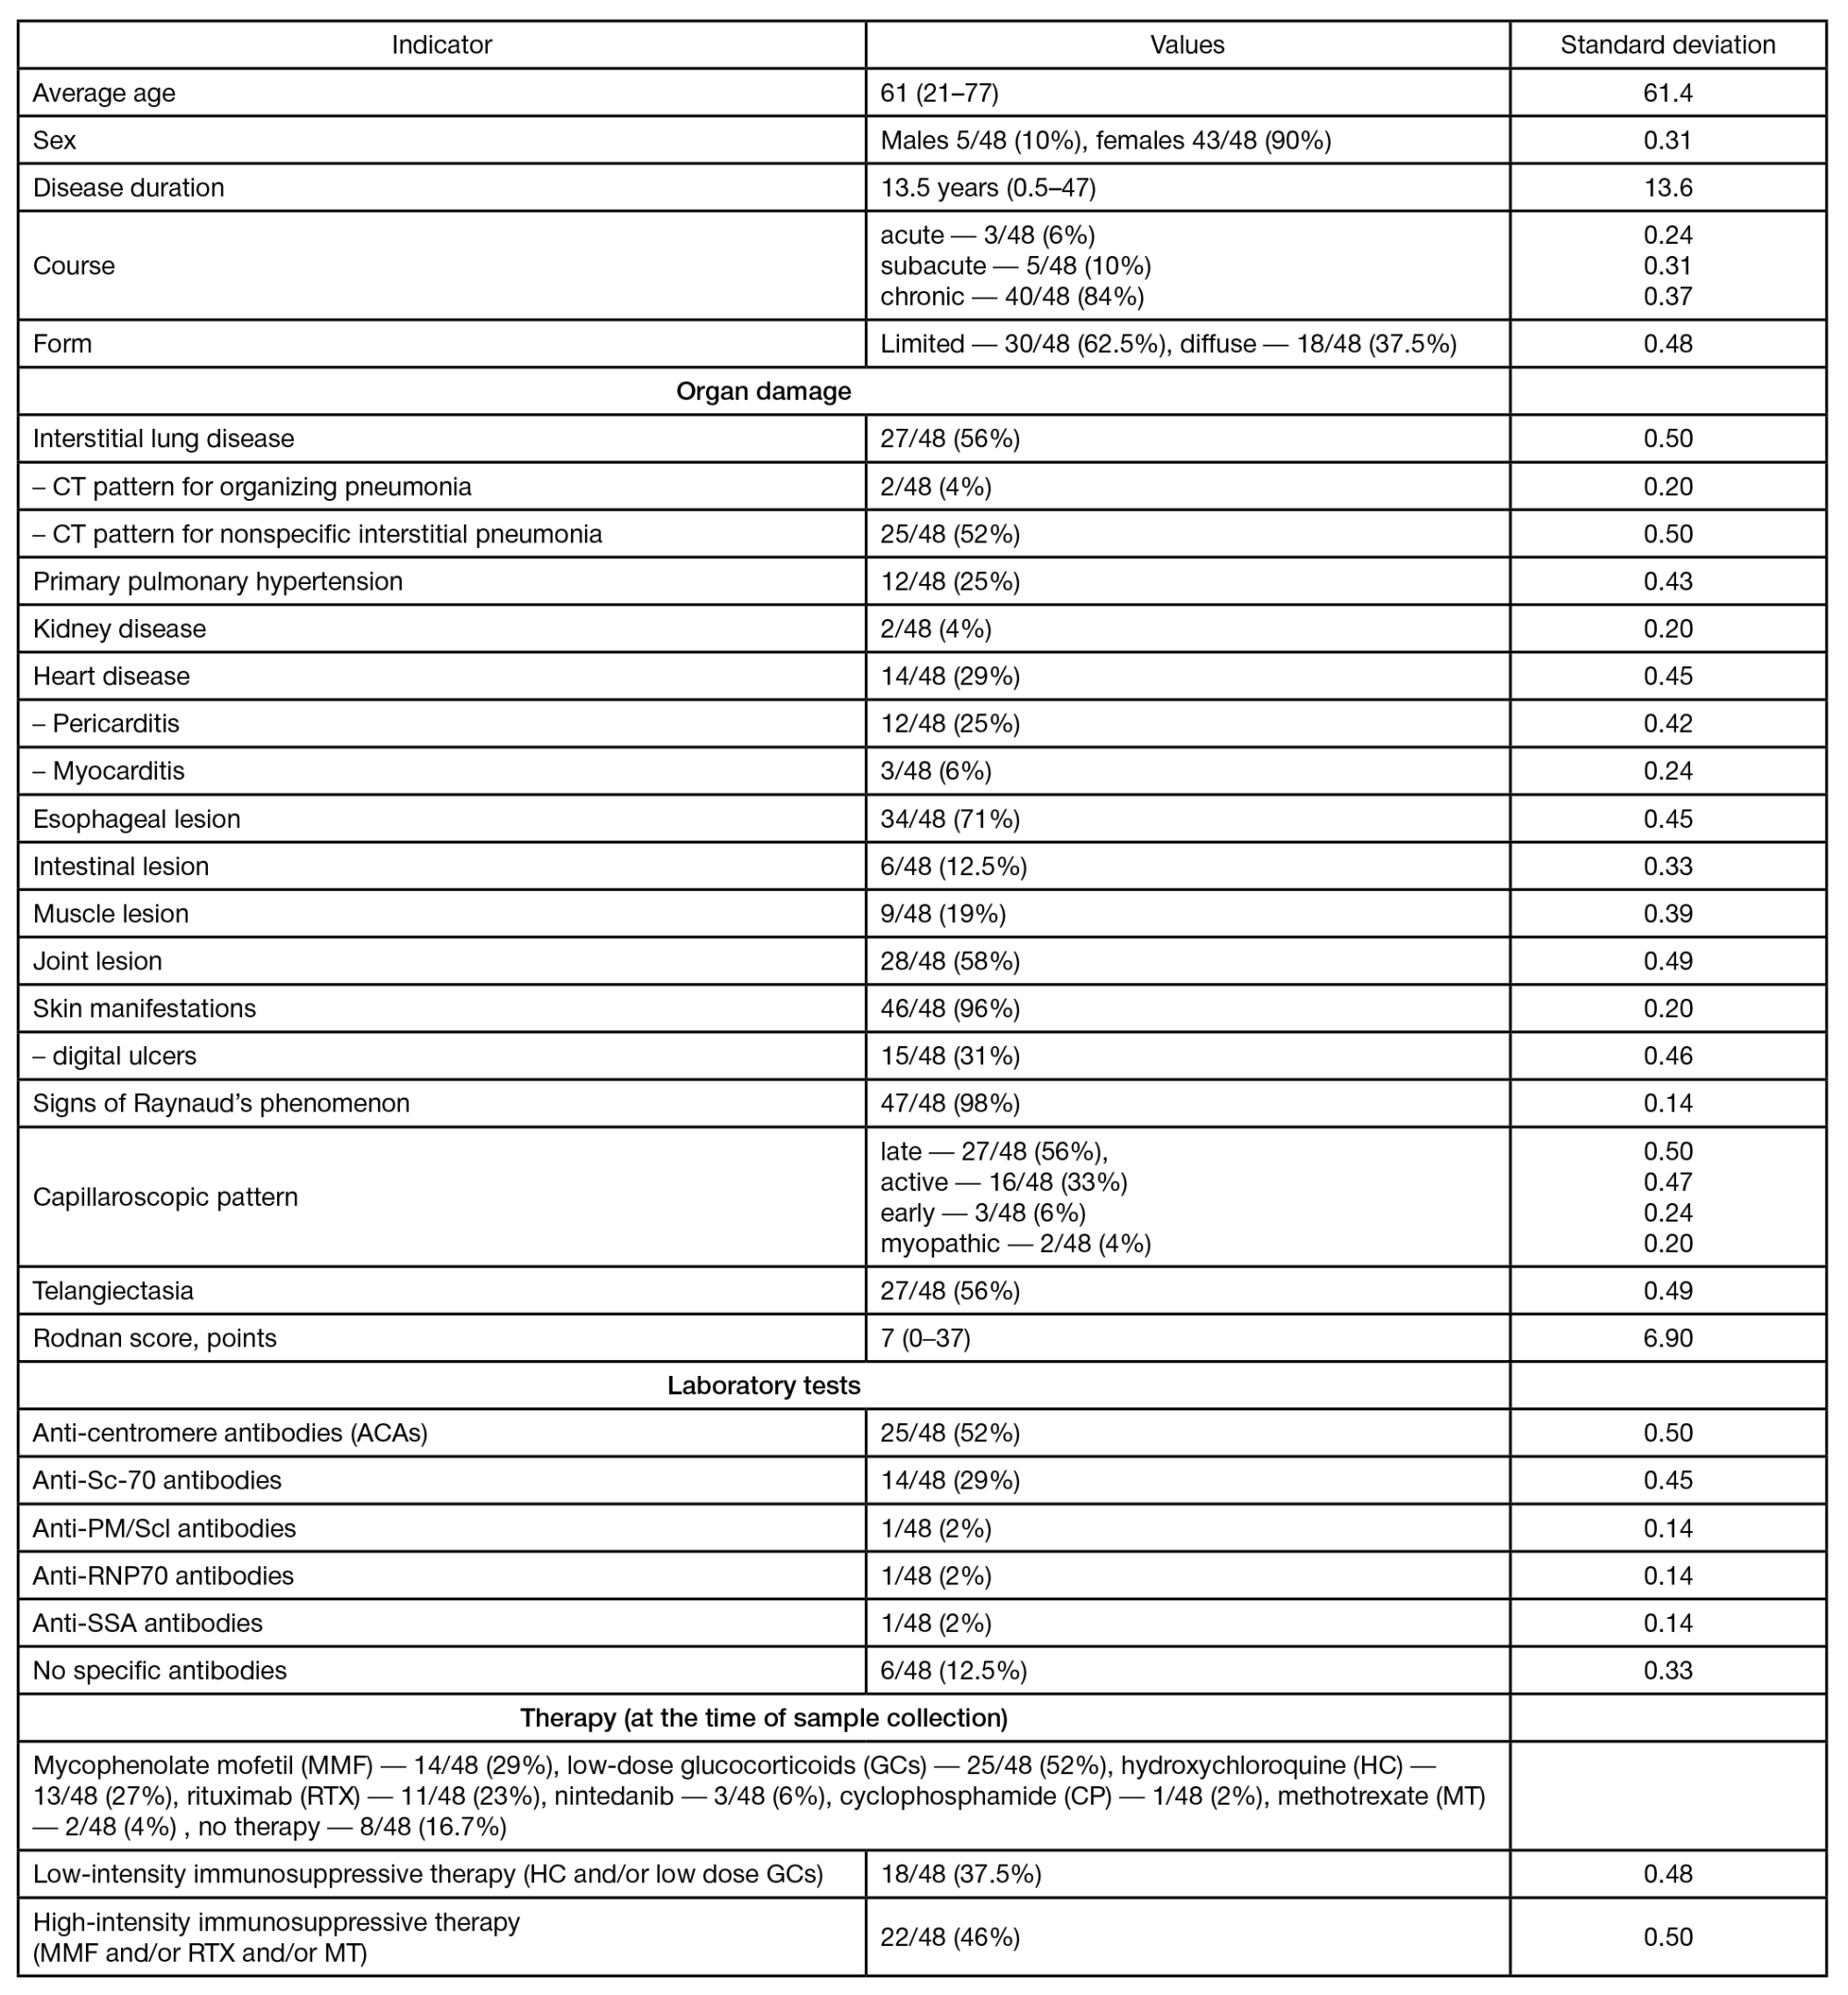
Table 1. Results of clinical and immunological assessment of SS patients (n = 48)
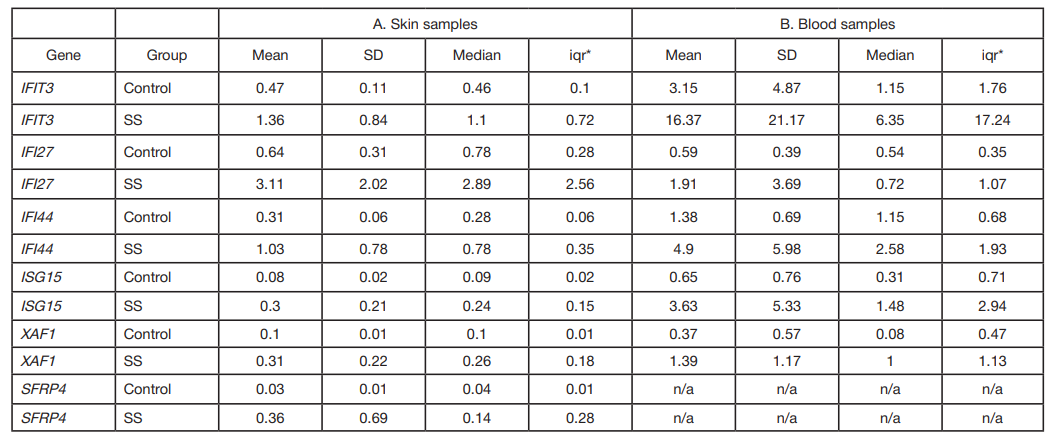
Table 2. Gene expression levels in skin samples in the groups of patients with SS (n = 23) and healthy donors (n = 3) (A), in peripheral blood samples in the groups of patients with SS (n = 35) and healthy donors (n = 31) (B)
Note: * iqr — interquartile range.
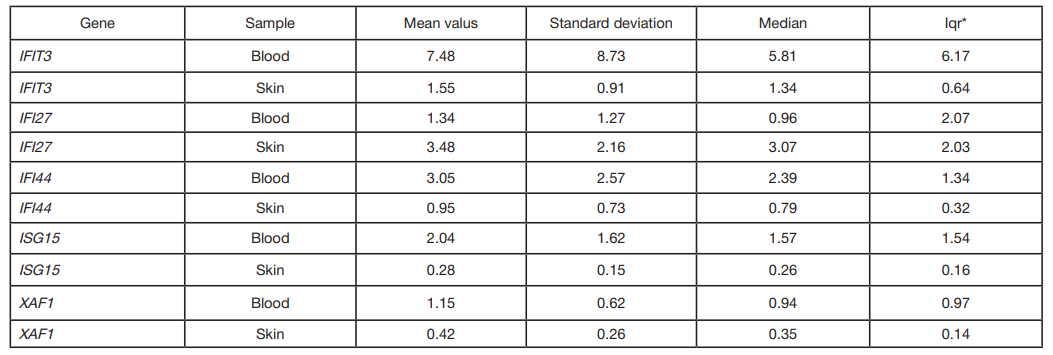
Table 3. Expression of the test genes IFIT3, IFI27, IFI44, ISG15, XAF1 in the RNA samples obtained from peripheral blood of the same SS patients (n = 10)
Note: * — interquartile range
Table 4. Values of the correlation between the expression of the IFN-I signature genes (IFI44, IFIT3, ISG15, IFI27, XAF1) in the samples and clinical signs of the group of SS patients for blood (n = 35), (4А) and skin (n = 23) samples (4B)