Copyright: © 2026 by the authors. Licensee: Pirogov University.
This article is an open access article distributed under the terms and conditions of the Creative Commons Attribution license (CC BY).

ORIGINAL RESEARCH

β-arrestin 2 knockout modulates inflammatory responses in a mouse model of streptozotocin-induced diabetes mellitus

Volkova AA1,2 , Gladkova AS2
About authors

1 Institute of Physiology, Pirogov Russian National Research Medical University, Moscow, Russia

2 Faculty of Biology, Lomonosov Moscow State University, Moscow, Russia

Correspondence should be addressed: Anna A. Volkova
Ostrovityanova, 1, Moscow, 117997; ur.umsr@4aa_avoklov

About paper

Funding: the study was supported by the RSF grant No. 24-75-00164 “Role of beta-arrestin in cerebral ischemia against the background of diabetes mellitus in mice”.

Author contribution: Volkova AA — study concept and planning the experiment, data acquisition and processing, manuscript writing and editing; Gladkova AS — data acquisition and processing, manuscript writing and editing.

Compliance with ethical standards: the study was approved by the Ethics Committee of the Pirogov Russian National Research Medical University (protocol No. 23/2021 dated December 13, 2021). All the procedures conducted during the study that involved animals were compliant with the ethical standards approved by legal acts of the Russian Federation, principles of Basel Declaration.
Received: 2026-04-14 Accepted: 2026-04-30 Published online: 2026-06-27
|
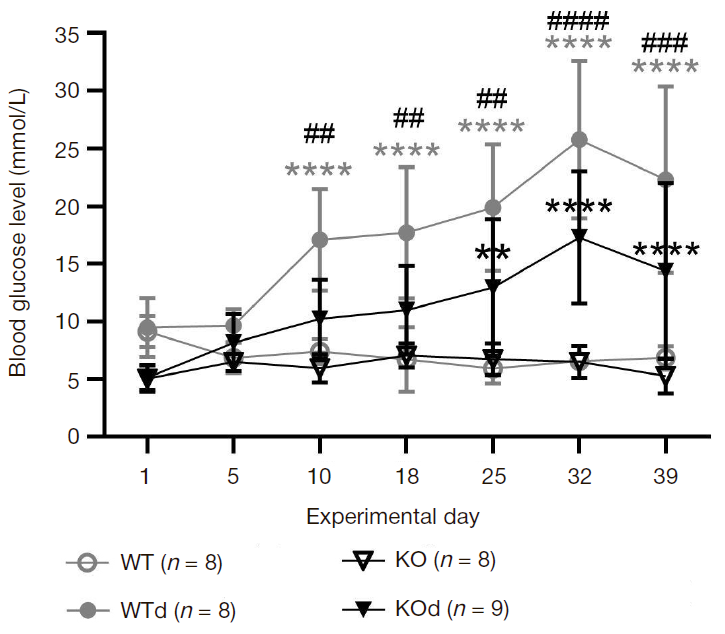
Fig. 1. Changes in blood glucose levels in mice in the control and streptozotocin (STZ)-induced diabetes groups. Two-way ANOVA, Tukey's test. ** — p < 0.01; ****— p < 0.0001 (WT/WTd and KO/KOd comparison); ## — p < 0.01; ### — p < 0.001; #### — p < 0.0001 (WTd/KOd comparison)
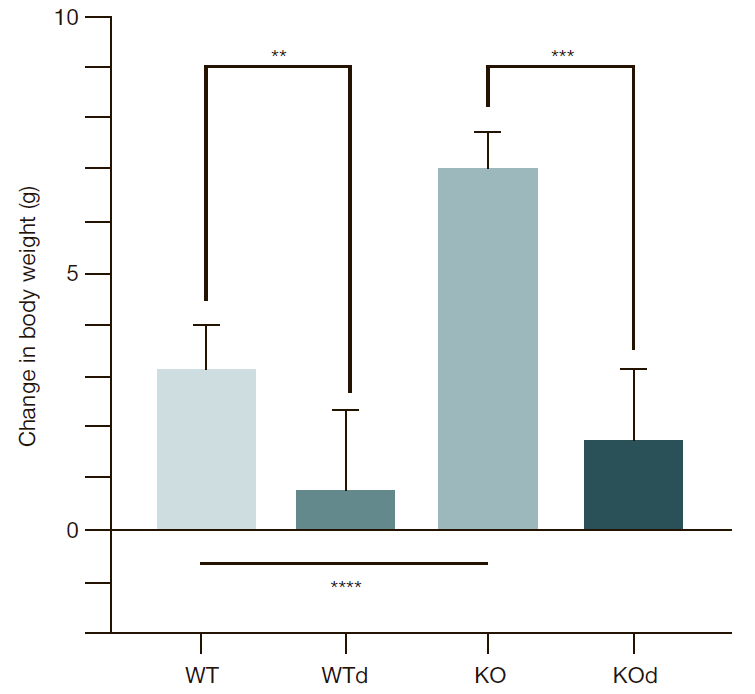
Fig. 2. Changes in body weight of animals in the studied groups (difference between final and initial days of the experiment). Data are presented as the mean ± standard deviation. Two-way ANOVA, Tukey's test. ** — p < 0.01; **** — p < 0.0001
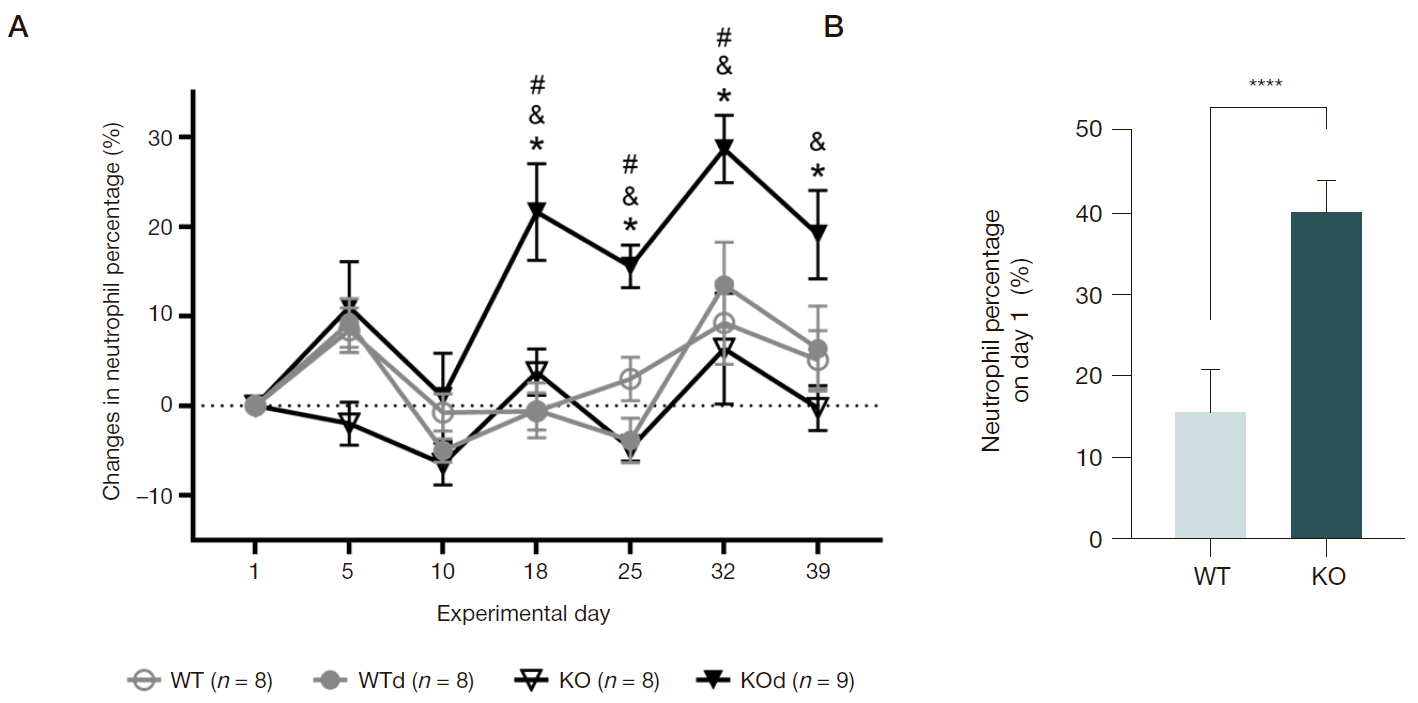
Fig. 3. Assessment of neutrophil levels in mice under diabetic conditions. А.Changes in neutrophil percentage (data normalized to day 1 values within each group) in the blood of control and STZ-induced diabetic mice. B. Neutrophil percentage in the blood of wild-type and Arrb2-knockout mice on day 1 of the experiment. Two-way ANOVA, Tukey’s test. * — p < 0.05 (KO/KOd comparison); & — p < 0.05 (difference within the KOd group relative to day 1); # — p < 0.05 (WTd/KOd comparison). Data are presented as the mean ± standard deviation. Unpaired t-test. p < 0.0001
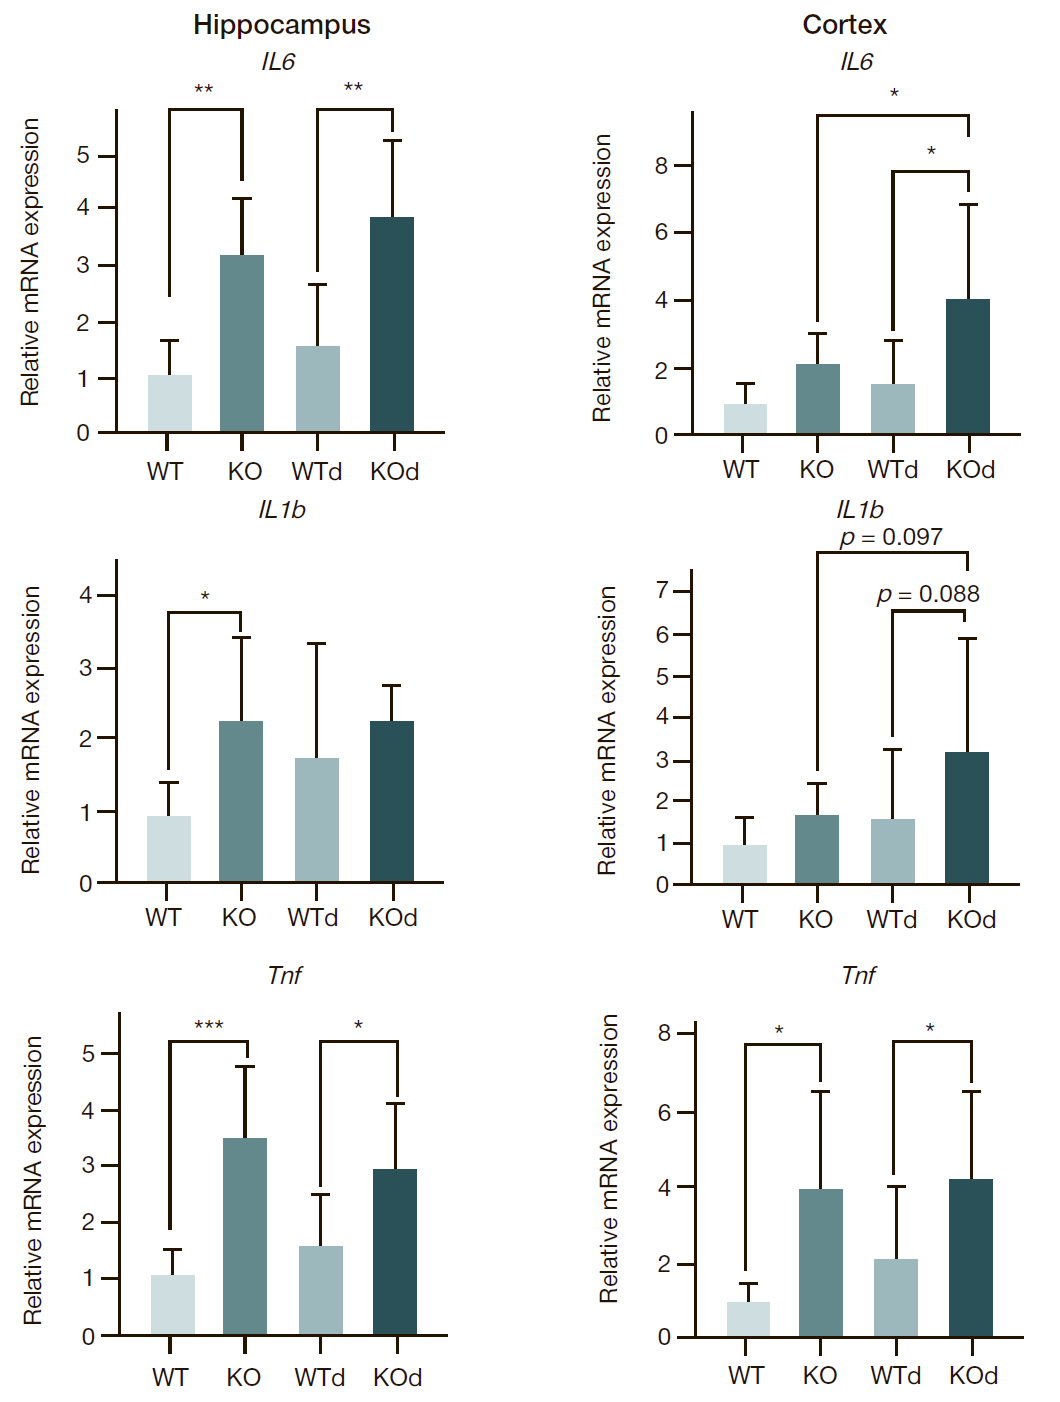
Fig. 4. Relative mRNA expression (fold change) of Il6, Il1b, and Tnf in the hippocampus and cerebral cortex of mice from the studied groups. Data are presented as values normalized to the expression of the reference β-actin gene. WT (n = 5–8); WTd (n = 5–8); KO (n = 5–8); KOd (n = 5–8). Data are presented as the mean ± standard deviation. Two-way ANOVA, Tukey’s test. * — p < 0.05; p < 0.01; * — p < 0.001
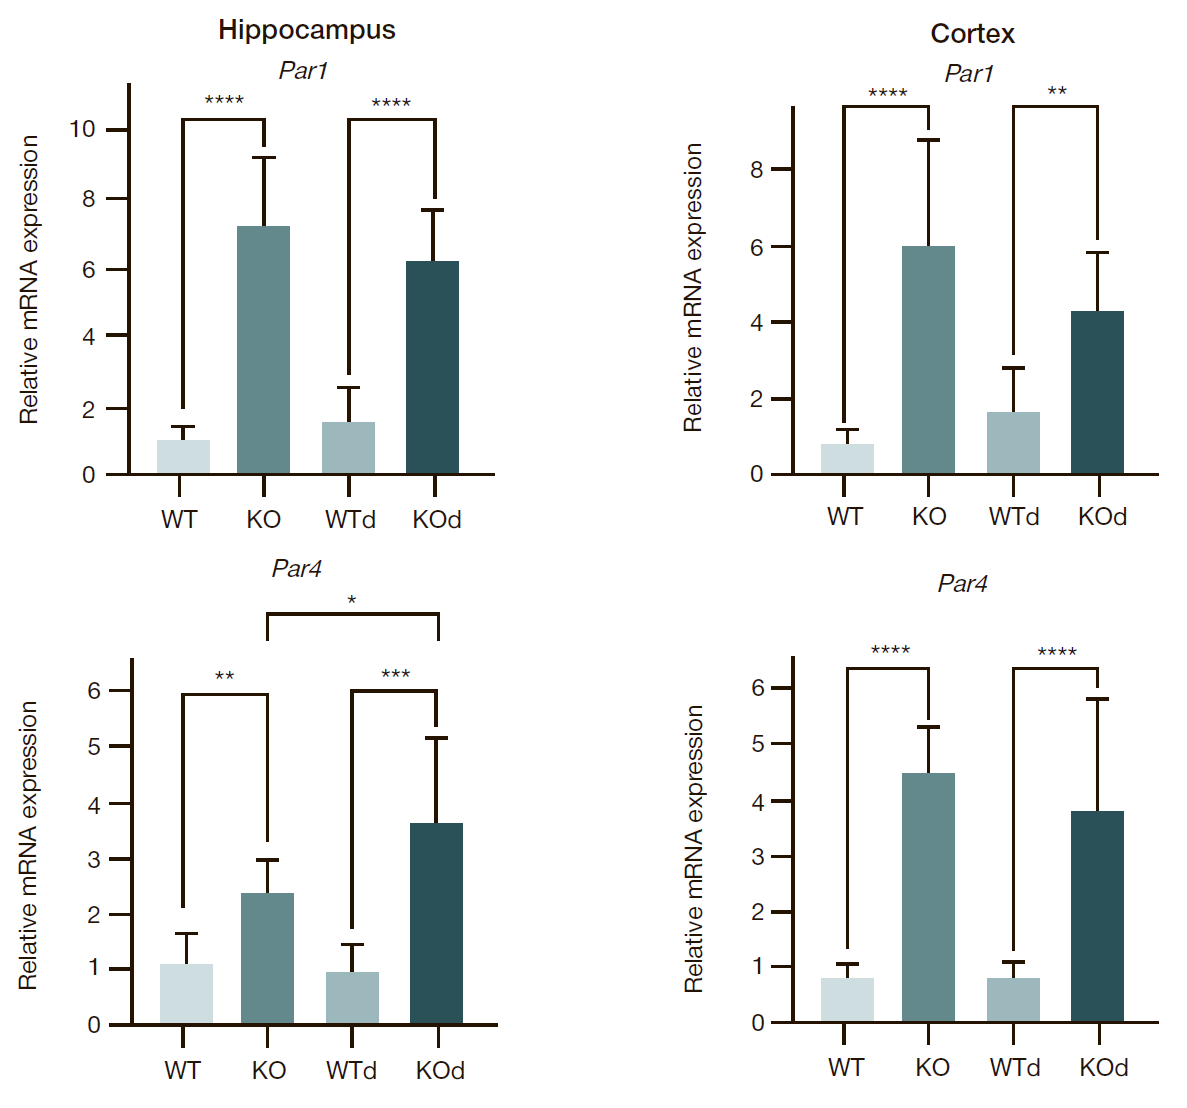
Fig. 5. Relative mRNA expression (fold change) of Par1 and Par4 in the hippocampus and cerebral cortex of mice from the studied groups. Data are presented as values normalized to the expression of the reference β-actin gene. WT (n = 5–8); WTd (n = 5–8); KO (n = 5–8); KOd (n = 5–8). Data are presented as the mean ± standard deviation. Two-way ANOVA, Tukey’s test. * — p < 0.05; ** — p < 0.01; **** — p < 0.0001
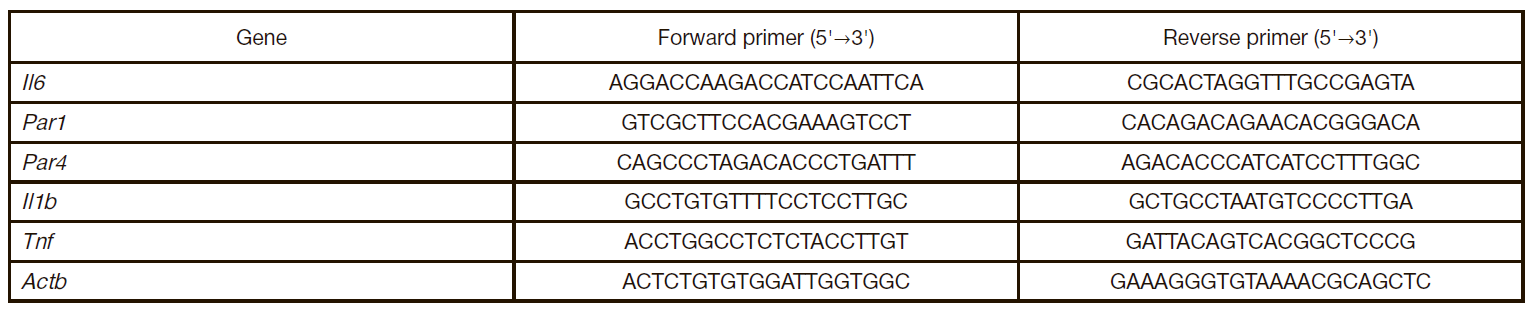
Table. Primers used for RT-PCR