Copyright: © 2026 by the authors. Licensee: Pirogov University.
This article is an open access article distributed under the terms and conditions of the Creative Commons Attribution license (CC BY).

ORIGINAL RESEARCH

Avidity profile of IgG against Toxocara canis in serological testing of adults in Almaty

Namet AM , Davlyatshin TI , Tussipova AA , Khairullin BM
About authors

Scientific Research and Production Center “MVA GROUP” LLP, Almaty Region, Kazakhstan

Correspondence should be addressed: Aiganym A. Tussipova
Zhambyla, 159, Almaty, 050000, Kazakhstan; moc.liamg@42t.mynagia

About paper

Funding: the study was conducted within the framework of the research and technology program IRN BR28712927 “Scientific and Technological Support of Biological Safety of the Republic of Kazakhstan in the Field of Medical Parasitology”.

Acknowledgments: the authors express their gratitude to the medical staff of Fenix Med LLC for their part in biomaterial collection.

Author contribution: Namet AM — developing the concept, data preparation and systematization, project administration, manuscript writing; Davlyatshin TI — developing the concept and methods, data analysis; Tussipova AA — research procedure, manuscript writing; Khairullin BM — developing methods, data preparation and systematization, project administration.

Compliance with ethical standards: the study was approved by the Ethics Committee of the Association of Bioethics and Medical Law (protocol No. 20 dated January 8, 2025). The informed consent was obtained before enrollment; we adhered to the principle of voluntary participation and the personal data confidentiality.
Received: 2026-09-10 Accepted: 2026-10-08 Published online: 2026-10-21
|
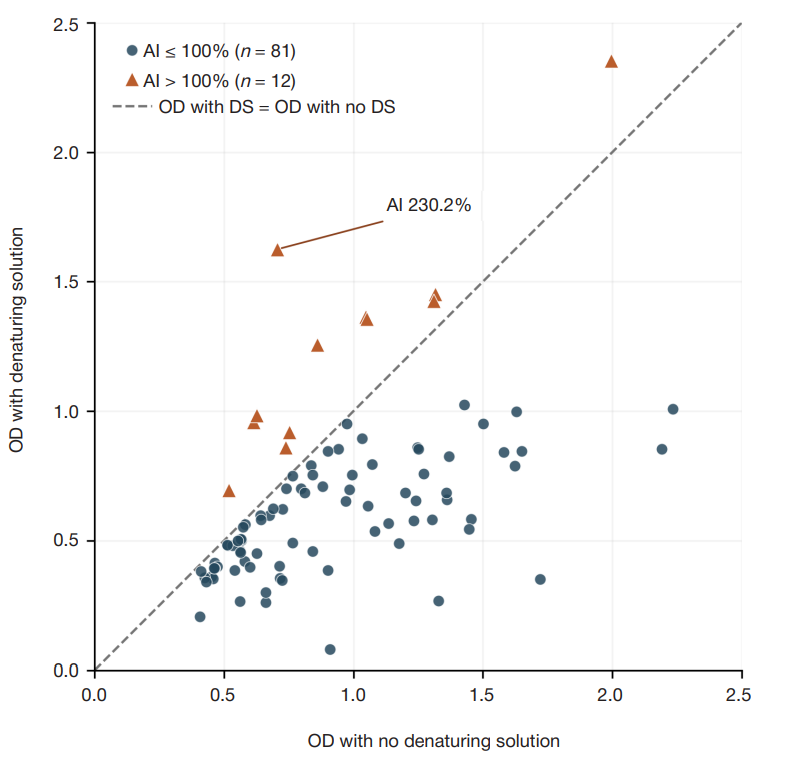
Fig. Comparison of OD in paired wells when determining avitidy of IgG against T. canis (n = 93). Each point corresponds to one sample. The dotted line means that OD-DS and OD-noDS are equal; position above the line corresponds to the AI >100%. All paired measurements are related to the avidity assay with the serum dilution 1 : 100. DS — denaturing solution; OD — optical density; AI — avidity index
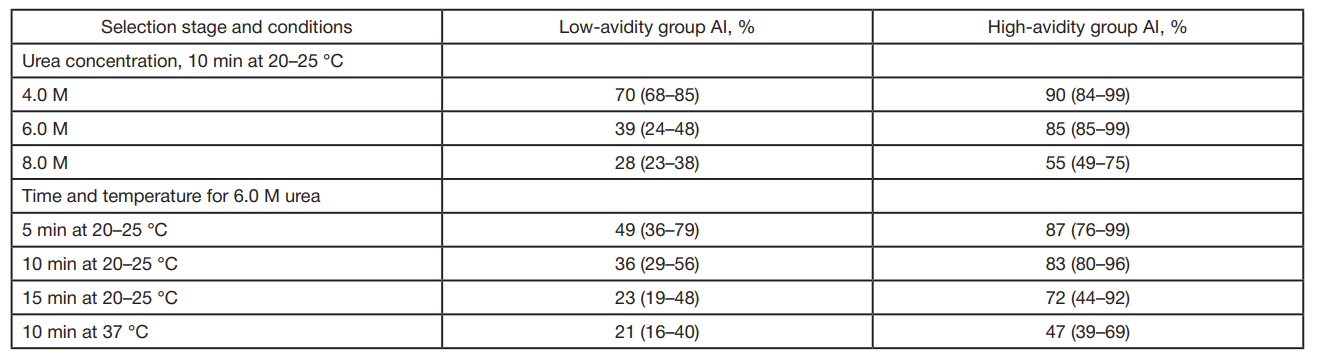
Table 1. Optimization of denaturing treatment conditions using control sera
Note: There are 10 control sera per group. The median and the range from the minimum to the maximum value are presented, not the interquartile range. AI — avidity index. Optimization of urea concentration and optimization of exposure time/temperature were performed as separate stages of assay development.
Table 2. Intra-assay and inter-assay variability of the avidity index
Note: AI — avidity index; SD — standard deviation; pp — percentage points; CV — coefficient of variation. CV was calculated as SD / mean × 100 and rounded to one decimal place. Inter-assay evaluation includes three independent assay runs
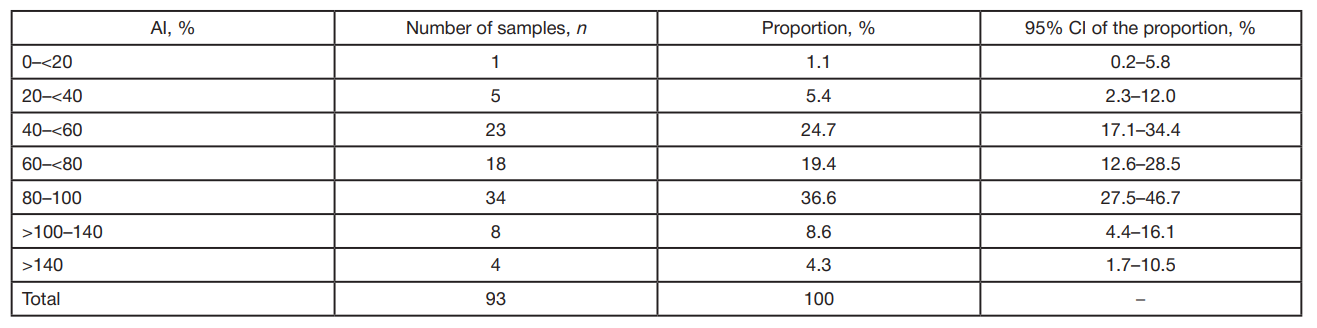
Table 3. Distribution of avidity index in IgG-positive samples
Note: AI — avidity index; IgG — immunoglobulin G; CI — confidence interval. The proportions were calculated based on 93 samples; CIs were calculated using the Wilson method. The intervals describe the distribution of values and do not indicate the clinical stage or duration of infection. Percentages may not sum to 100% because of rounding.
Table 4. Avidity index according to the strength of the positive ELISA response
Note: ELISA — enzyme-linked immunosorbent assay; AI — avidity index; Me — median; Q1 and Q3 — 1st and 3rd quartiles. Percentages were calculated using the number of samples in the corresponding row. Selected intervals are shown; therefore, the proportions in a row do not sum to 100%. Overall comparison of distributions: H = 20.97, 2 degrees of freedom, p < 0.001 (Kruskal–Wallis test); no pairwise comparisons were performed.