Copyright: © 2026 by the authors. Licensee: Pirogov University.
This article is an open access article distributed under the terms and conditions of the Creative Commons Attribution license (CC BY).

ORIGINAL RESEARCH

Effect of dexamethasone on plasma C-reactive protein concentrations in rats with arthrosis combined with obesity

About authors

1 Scientific and Diagnostic Center "Polyclinic on Smolenskaya", Moscow, Russia

2 MEDSI Clinic, Clinical Hospital No. 1, Krasnogorsk, Russia

3 St. Luke Lugansk State Medical University, Russia

Correspondence should be addressed: Aleksey S. Ivanov
Stolyarny pereulok, 7, str. 2, Moscow, 123022, Russia; ur.liam@5891golotamvartahsas

About paper

Author contribution: Ivanov AS — study planning and design, literature review, experimental procedure; Tananakina TP — study planning and design, experimental procedure, research support, manuscript writing; Kashchenko SA — scientific editing, advice on the experimental procedure, manuscript writing; Pogorelova IA — calculation of results, drug dose selection and titration, advice on animal handling; Alexandrov IA — experimental animal handling, drug administration, blood sampling for analysis, contribution to withdrawal of animals from the experiment.

Compliance with ethical standards: the study approved by the Ethics Committee of the St. Luke Lugansk State Medical University (protocol No. 2 dated September 23, 2025) was fully compliant with the Eurasian Economic Commission (EEC) Board "Guidelines for the Use of Laboratory (Experimental) Animals in Preclinical (NonClinical) Studies" dated November 14, 2023, No. 33, principles of the European Convention for the Protection of Vertebrate Animals used for Experimental and Other Scientific Purposes, s well as the Directive of the European Parliament and of the Council of the European Union on the Protection of Animals Used for Scientific Purposes.
Received: 2026-08-27 Accepted: 2026-10-05 Published online: 2026-10-19
|
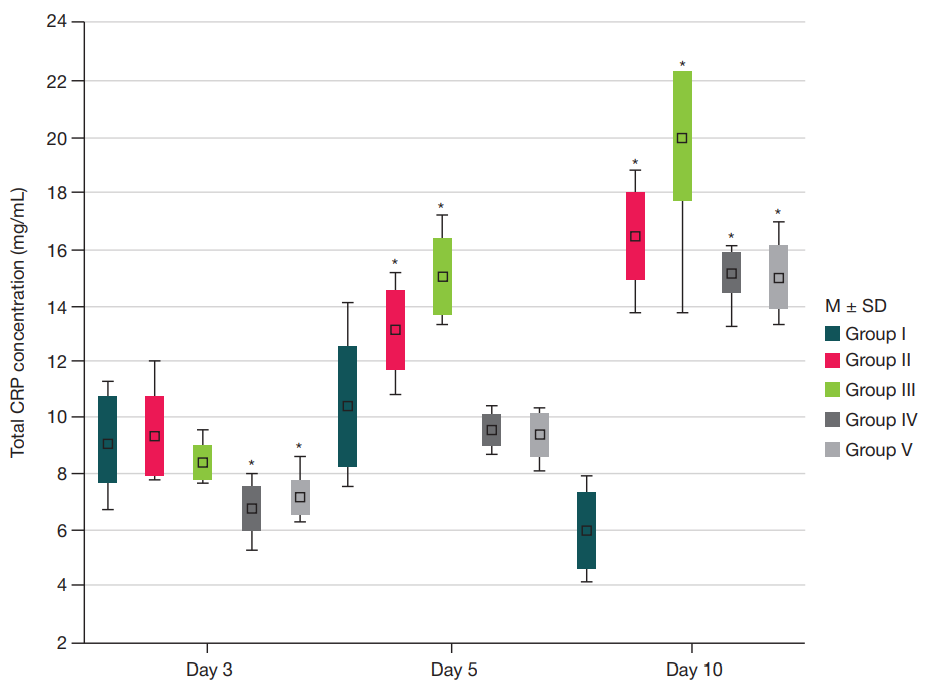
Fig. 1. Dynamic changes in the rat plasma total C-reactive protein (CRP) concentration (mg/L) in experimental groups on days 3, 5, and 10. Data are presented as (M ± SD), where M is the sample mean and SD is the standard deviation; n = 36 is the number of animals per experimental group for each time interval; * — significant differences compared to the intact control values (group I) on the same day (p < 0,05); taking into account the Bonferroni correction
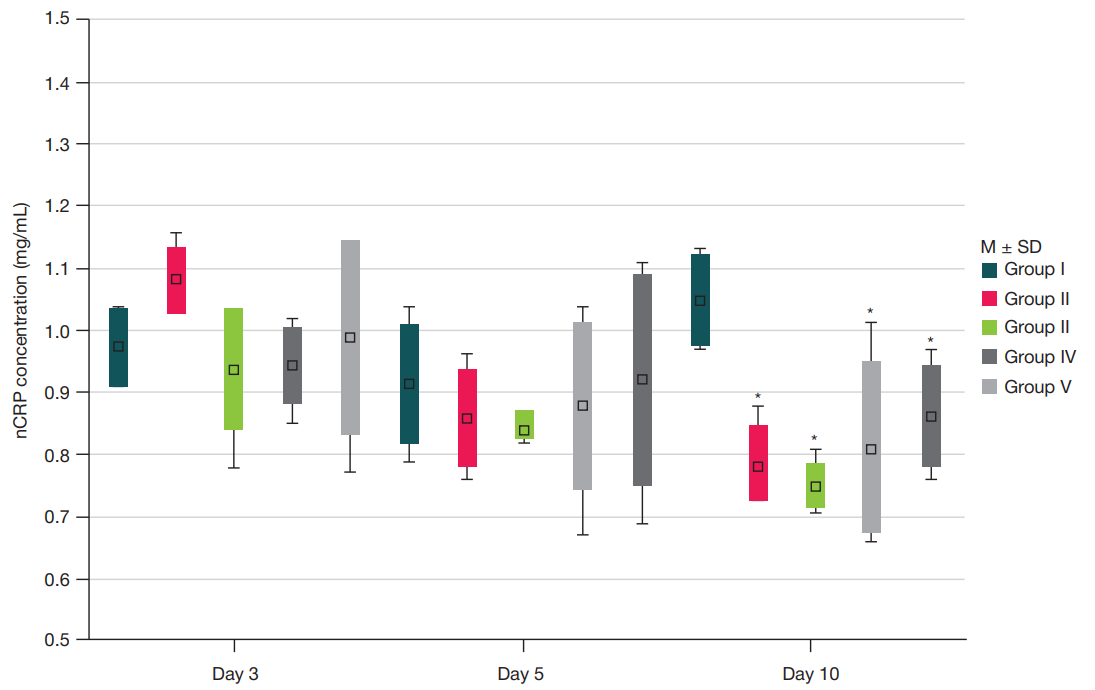
Fig. 2. Dynamic changes in the rat plasma native C-reactive protein (nCRP) concentration on days 3, 5, and 10 of the experiment. Data are presented as (M ± SD), where M is the sample mean and SD is the standard deviation. n = 36 is the number of animals per experimental group for each time interval. * — significant differences compared to the intact control values (group I) on the same day (p < 0.05); taking into account the Bonferroni correction
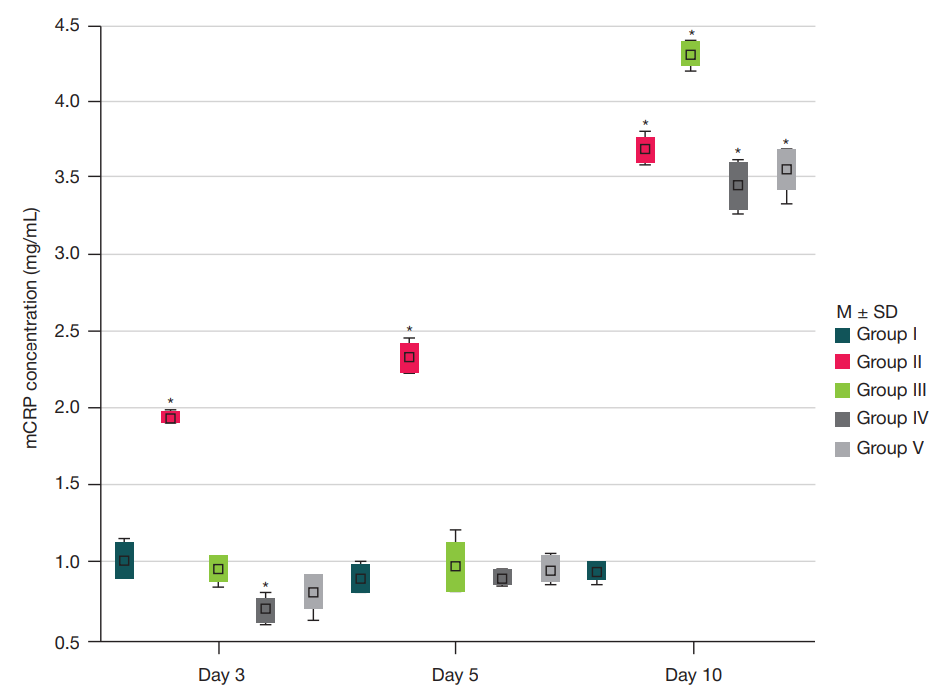
Fig. 3. Dynamic changes in the rat plasma monomeric C-reactive protein (mCRP) concentration on days 3, 5, and 10 of the experiment. Data are presented as (M ± SD), where M is the sample mean and SD is the standard deviation. n = 36 is the number of animals per experimental group for each time interval. * — significant differences compared to the intact control values (group I) on the same day (p < 0.05); taking into account the Bonferroni correction
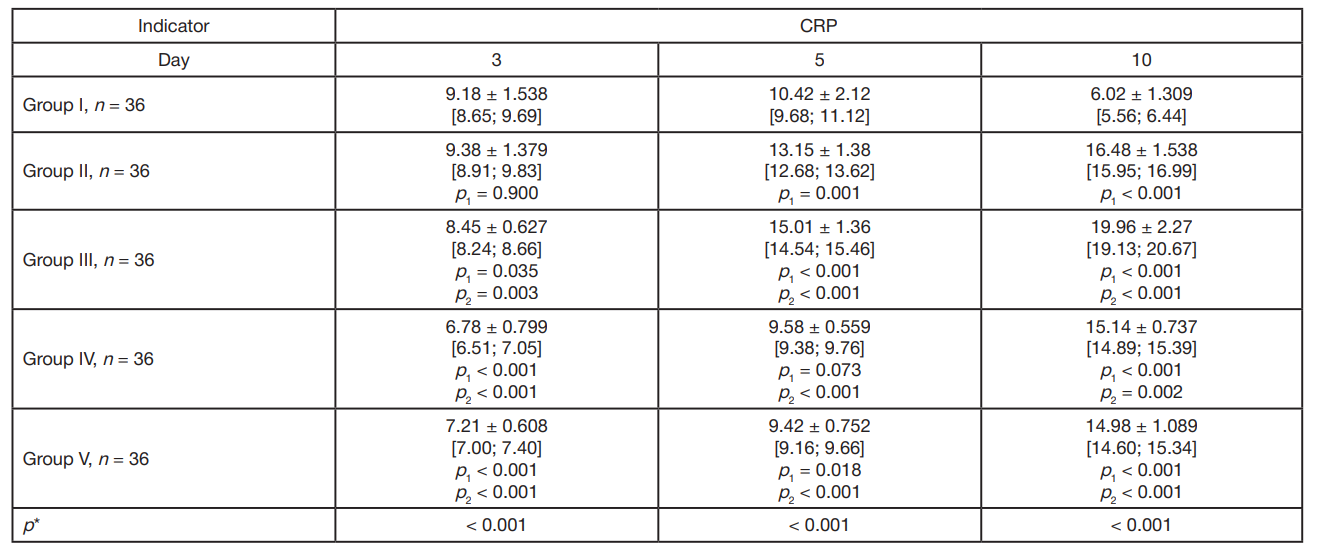
Table 1. Plasma total C-reactive protein (CRP) concentration (mg/L) in rats of groups I–V on days 3, 5, and 10 of the experiment
Note: n — number of animals per group. Data are presented as M ± SD [95% confidence interval]; * — the Kruskal–Wallis test was used; p1 — significance of differences compared with the indicators of group I (control, taking into account the Bonferroni correction); p2 — significance of differences compared with the indicators of group II (untreated disorder, taking into account the Bonferroni correction).
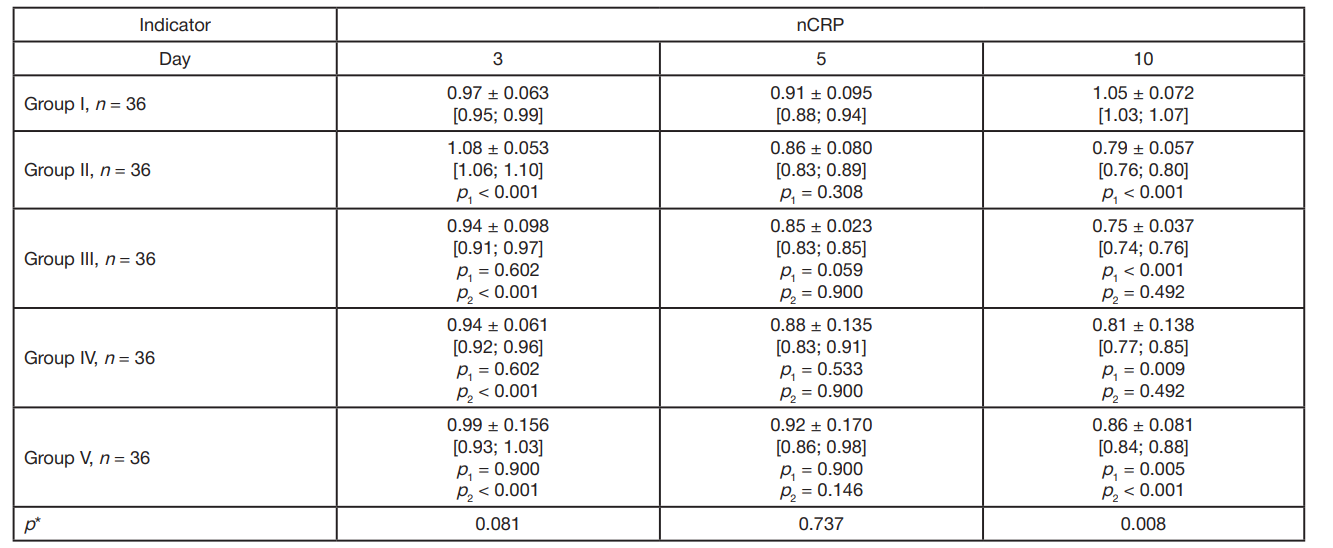
Table 2. Dynamic changes in rat plasma nCRP protein concentrations (mg/L) in experimental groups on days 3, 5, and 10 of the study
Note: n — number of animals per group. Data are presented as M ± SD [95% confidence interval]; * — the Kruskal–Wallis test was used; p1 — significance of differences compared with the indicators of group I (control, taking into account the Bonferroni correction); p2 — significance of differences compared with the indicators of group II (untreated disorder, taking into account the Bonferroni correction).
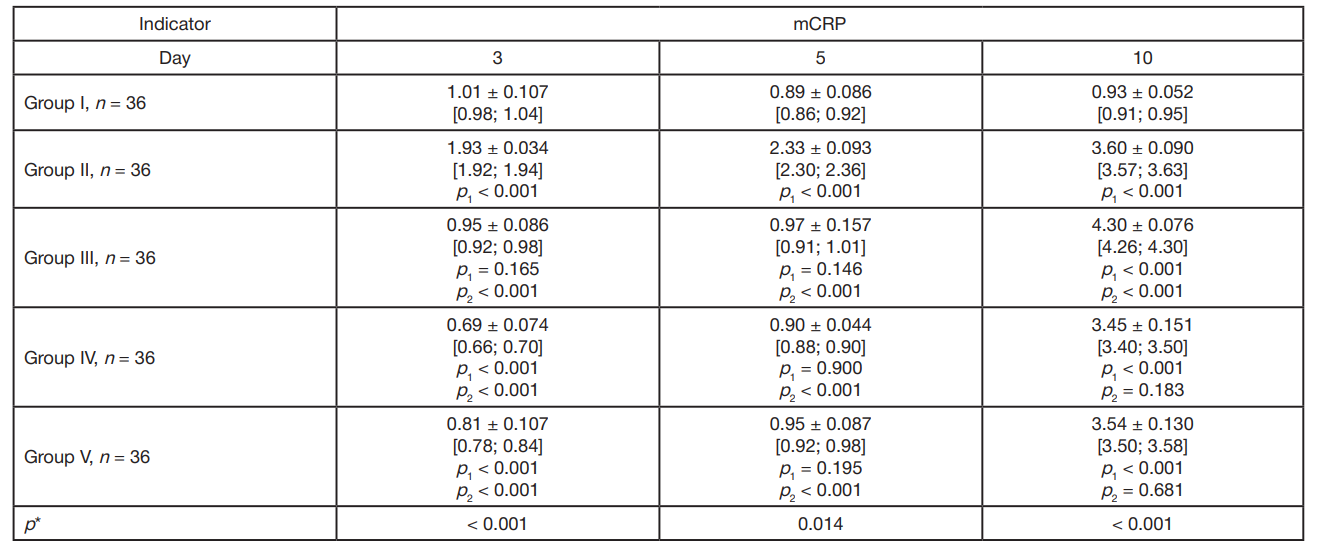
Table 3. Dynamic changes in the rat plasma mCRP protein concentrations (mg/L) in the experimental groups on days 3, 5, and 10 of the study (M ±S D [95% confidence interval])
Note: n — number of animals per group. Data are presented as M ± SD [95% confidence interval]; * — the Kruskal–Wallis test was used; p1 — significance of differences compared with the indicators of group I (control, taking into account the Bonferroni correction); p2 — significance of differences compared with the indicators of group II (untreated disorder, taking into account the Bonferroni correction).