ORIGINAL RESEARCH

Identification of microorganisms by Fourier-transform infrared spectroscopy

Suntsova AYu1, Guliev RR1, Popov DA2, Vostrikova TYu2, Dubodelov DV3, Shchegolikhin AN1, Laypanov BK5, Priputnevich TV3, Shevelev AB1,4, Kurochkin IN1
About authors

1 Emanuel Institute of Biochemical Physics of the Russian Academy of Sciences, Moscow, Russia

2 Bakulev National Medical Research Center of Cardiovascular Surgery, Moscow

3 Kulakov National Medical Research Center for Obstetrics, Gynecology and Perinatology, Moscow, Russia

4 Vavilov Institute of General Genetics, Russian Academy of Sciences, Moscow, Russia

5 Skryabin Moscow State Academy of Veterinary Medicine and Biotechnology, Moscow

Correspondence should be addressed: Alexei B. Shevelev
Kosygina 4, Moscow, 119334; moc.liamtoh@a_levehs
Received: 2018-08-01 Accepted: 2018-08-25 Published online: 2018-09-29
|
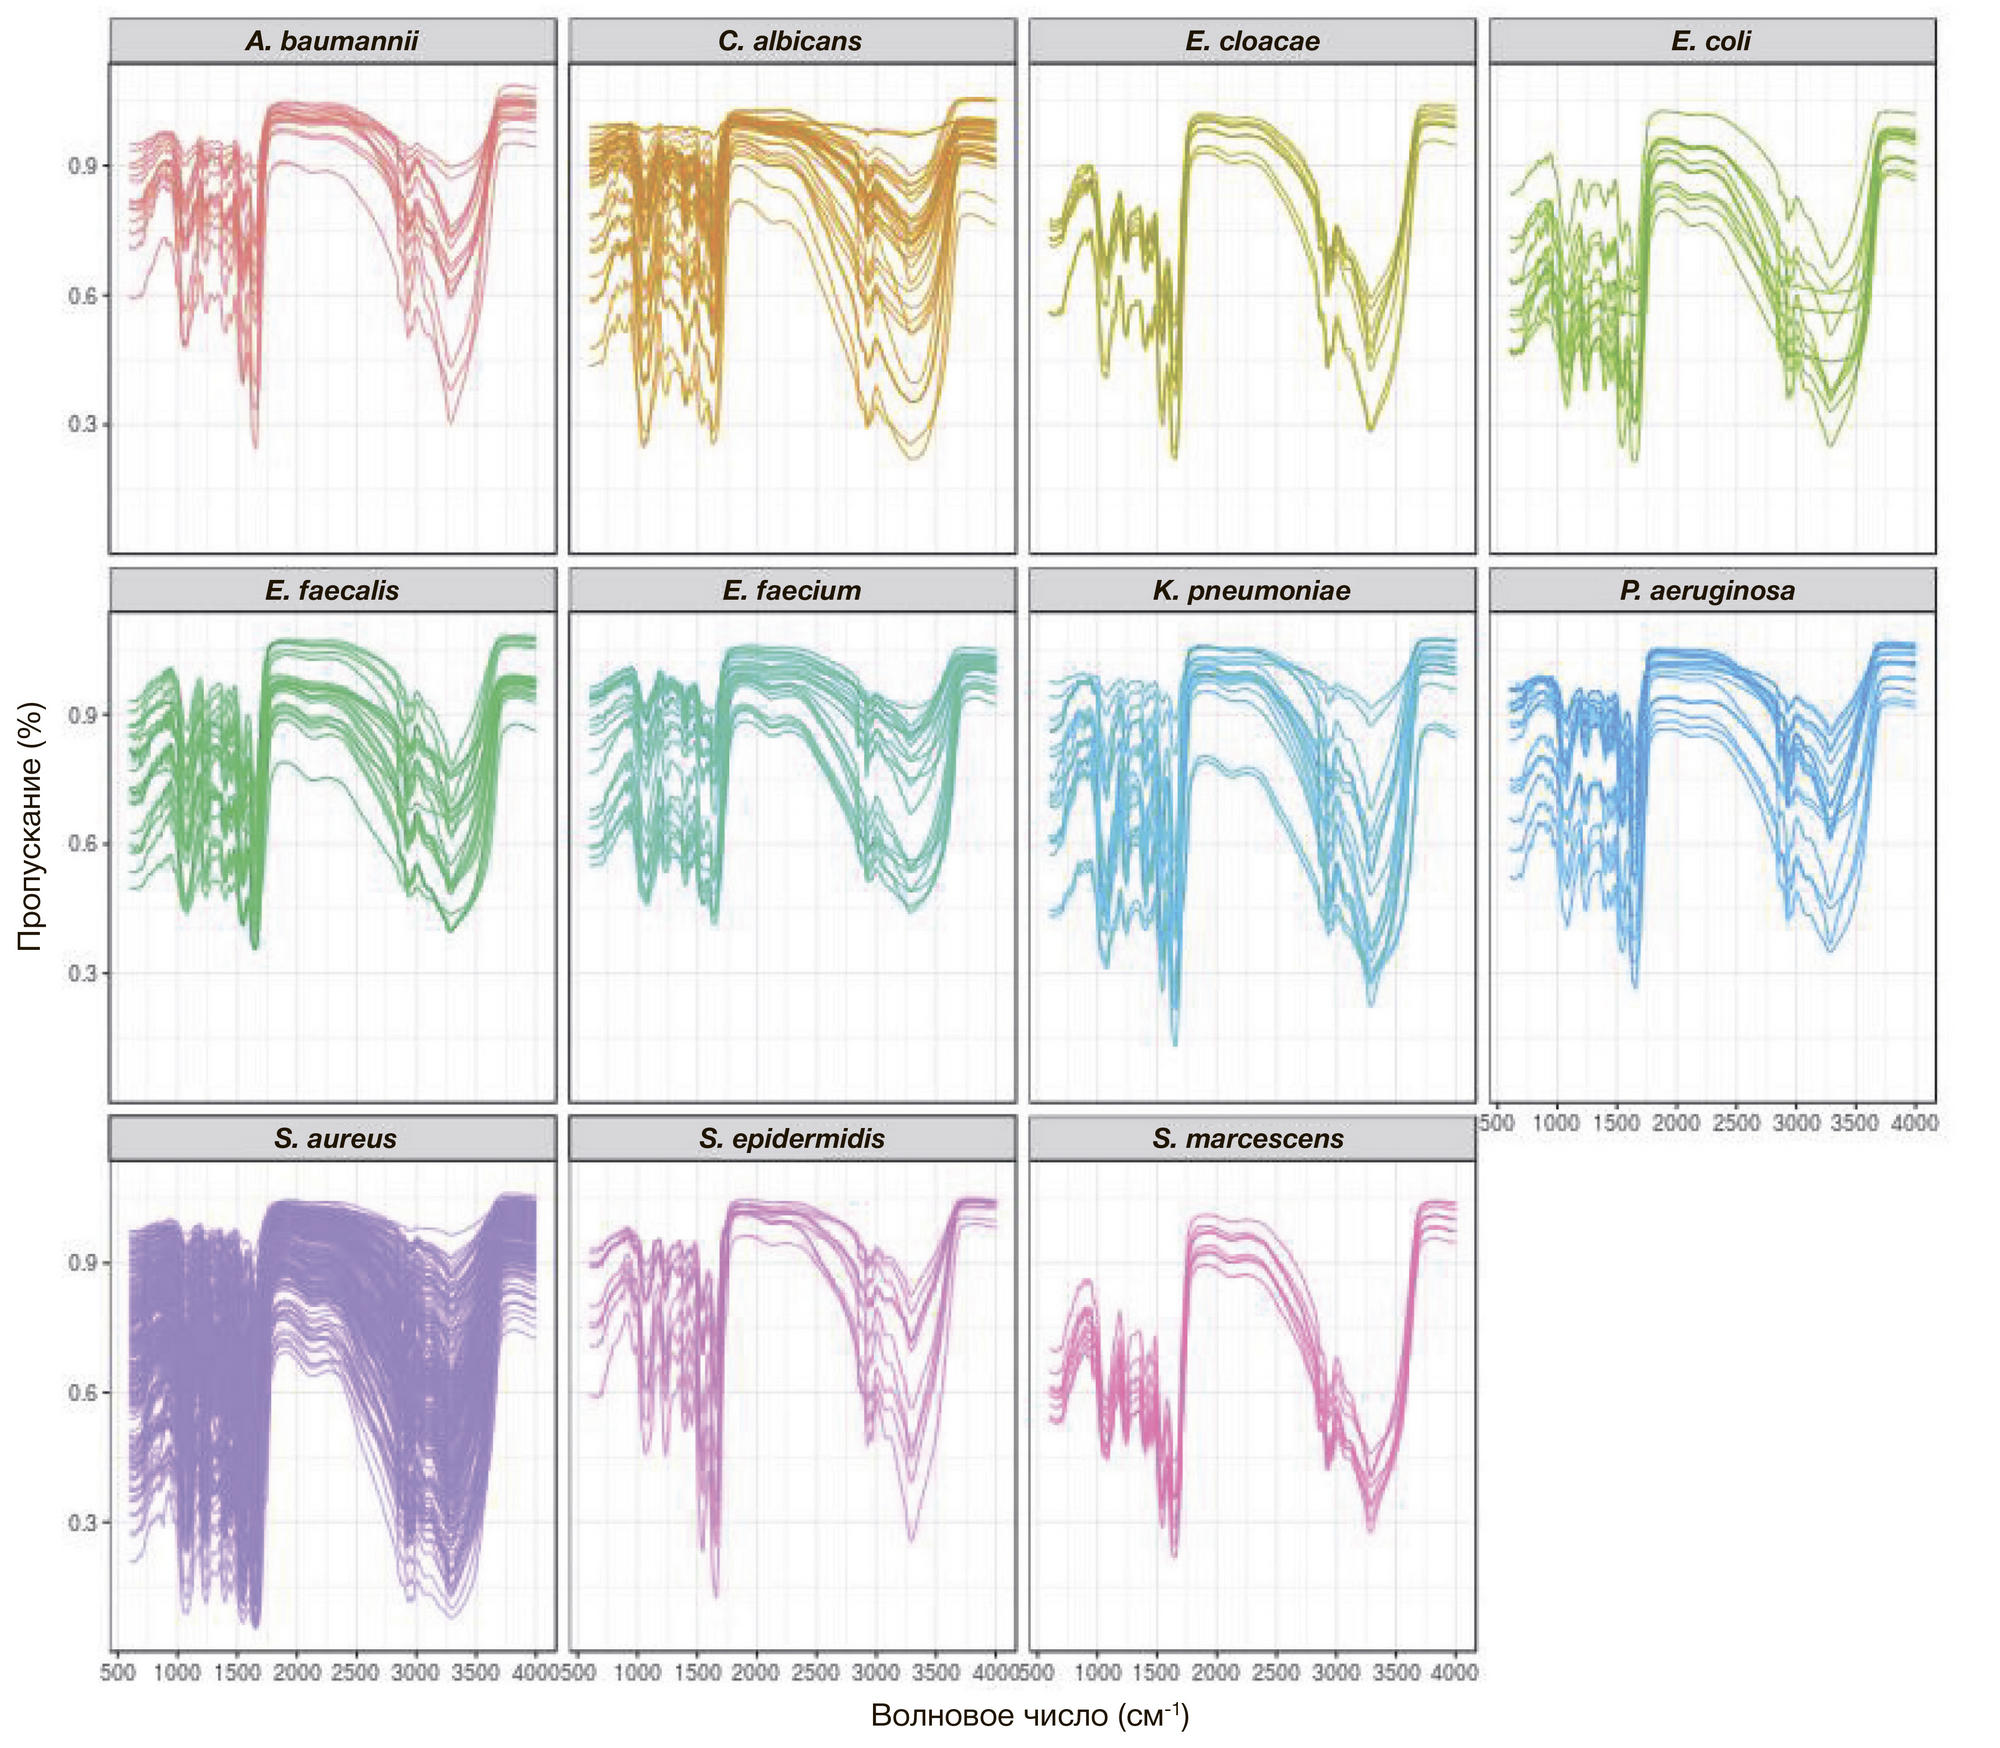
Fig. 1. The raw Fourier transform infrared spectra of pathogenic bacteria. Left to right and top to bottom are the spectra of A. baumannii, C. albicans, E. cloacae, E. coli, E. faecalis, E. faecium, K. pneumoniae, P. aeruginosa, S. aureus, S. epidermidis, and S. marcescens expressed in the units of light transmission
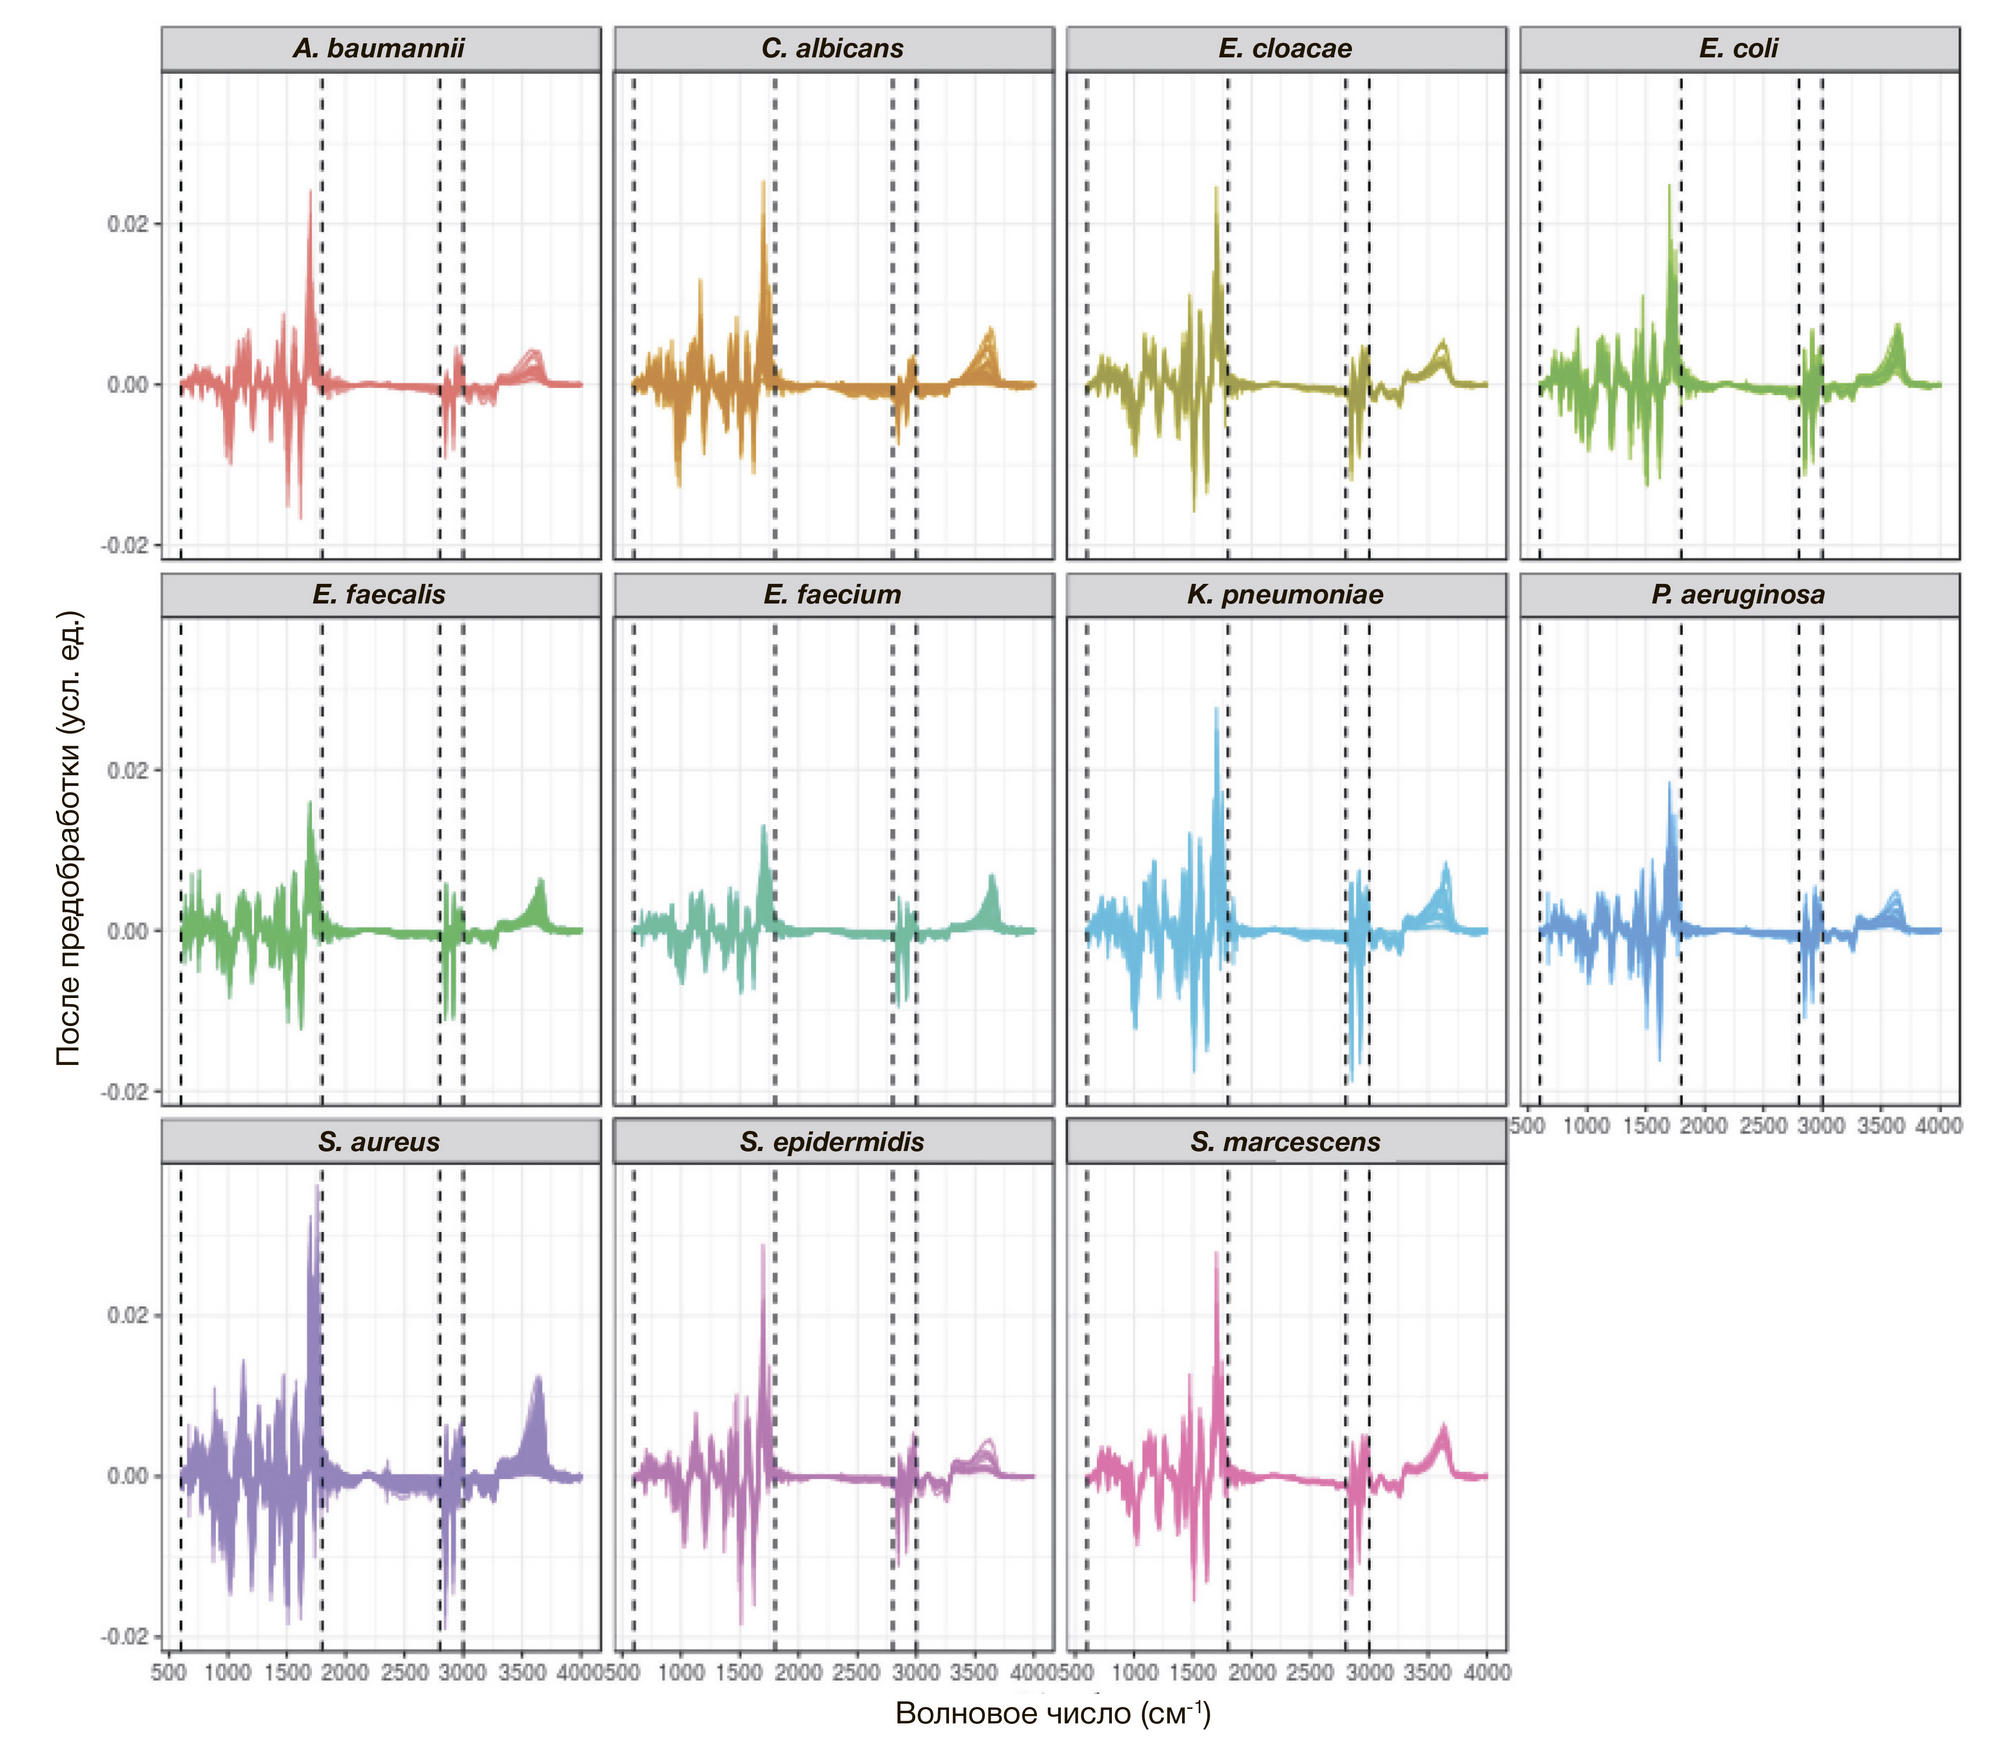
Fig. 2. The Fourier transform infrared spectra after preprocessing: normalization to the average transmission and calculation of the first derivative. Dotted lines show the boundaries of the wavenumber ranges used in the analysis: 600, 1800, 2800, 3000 cm-1
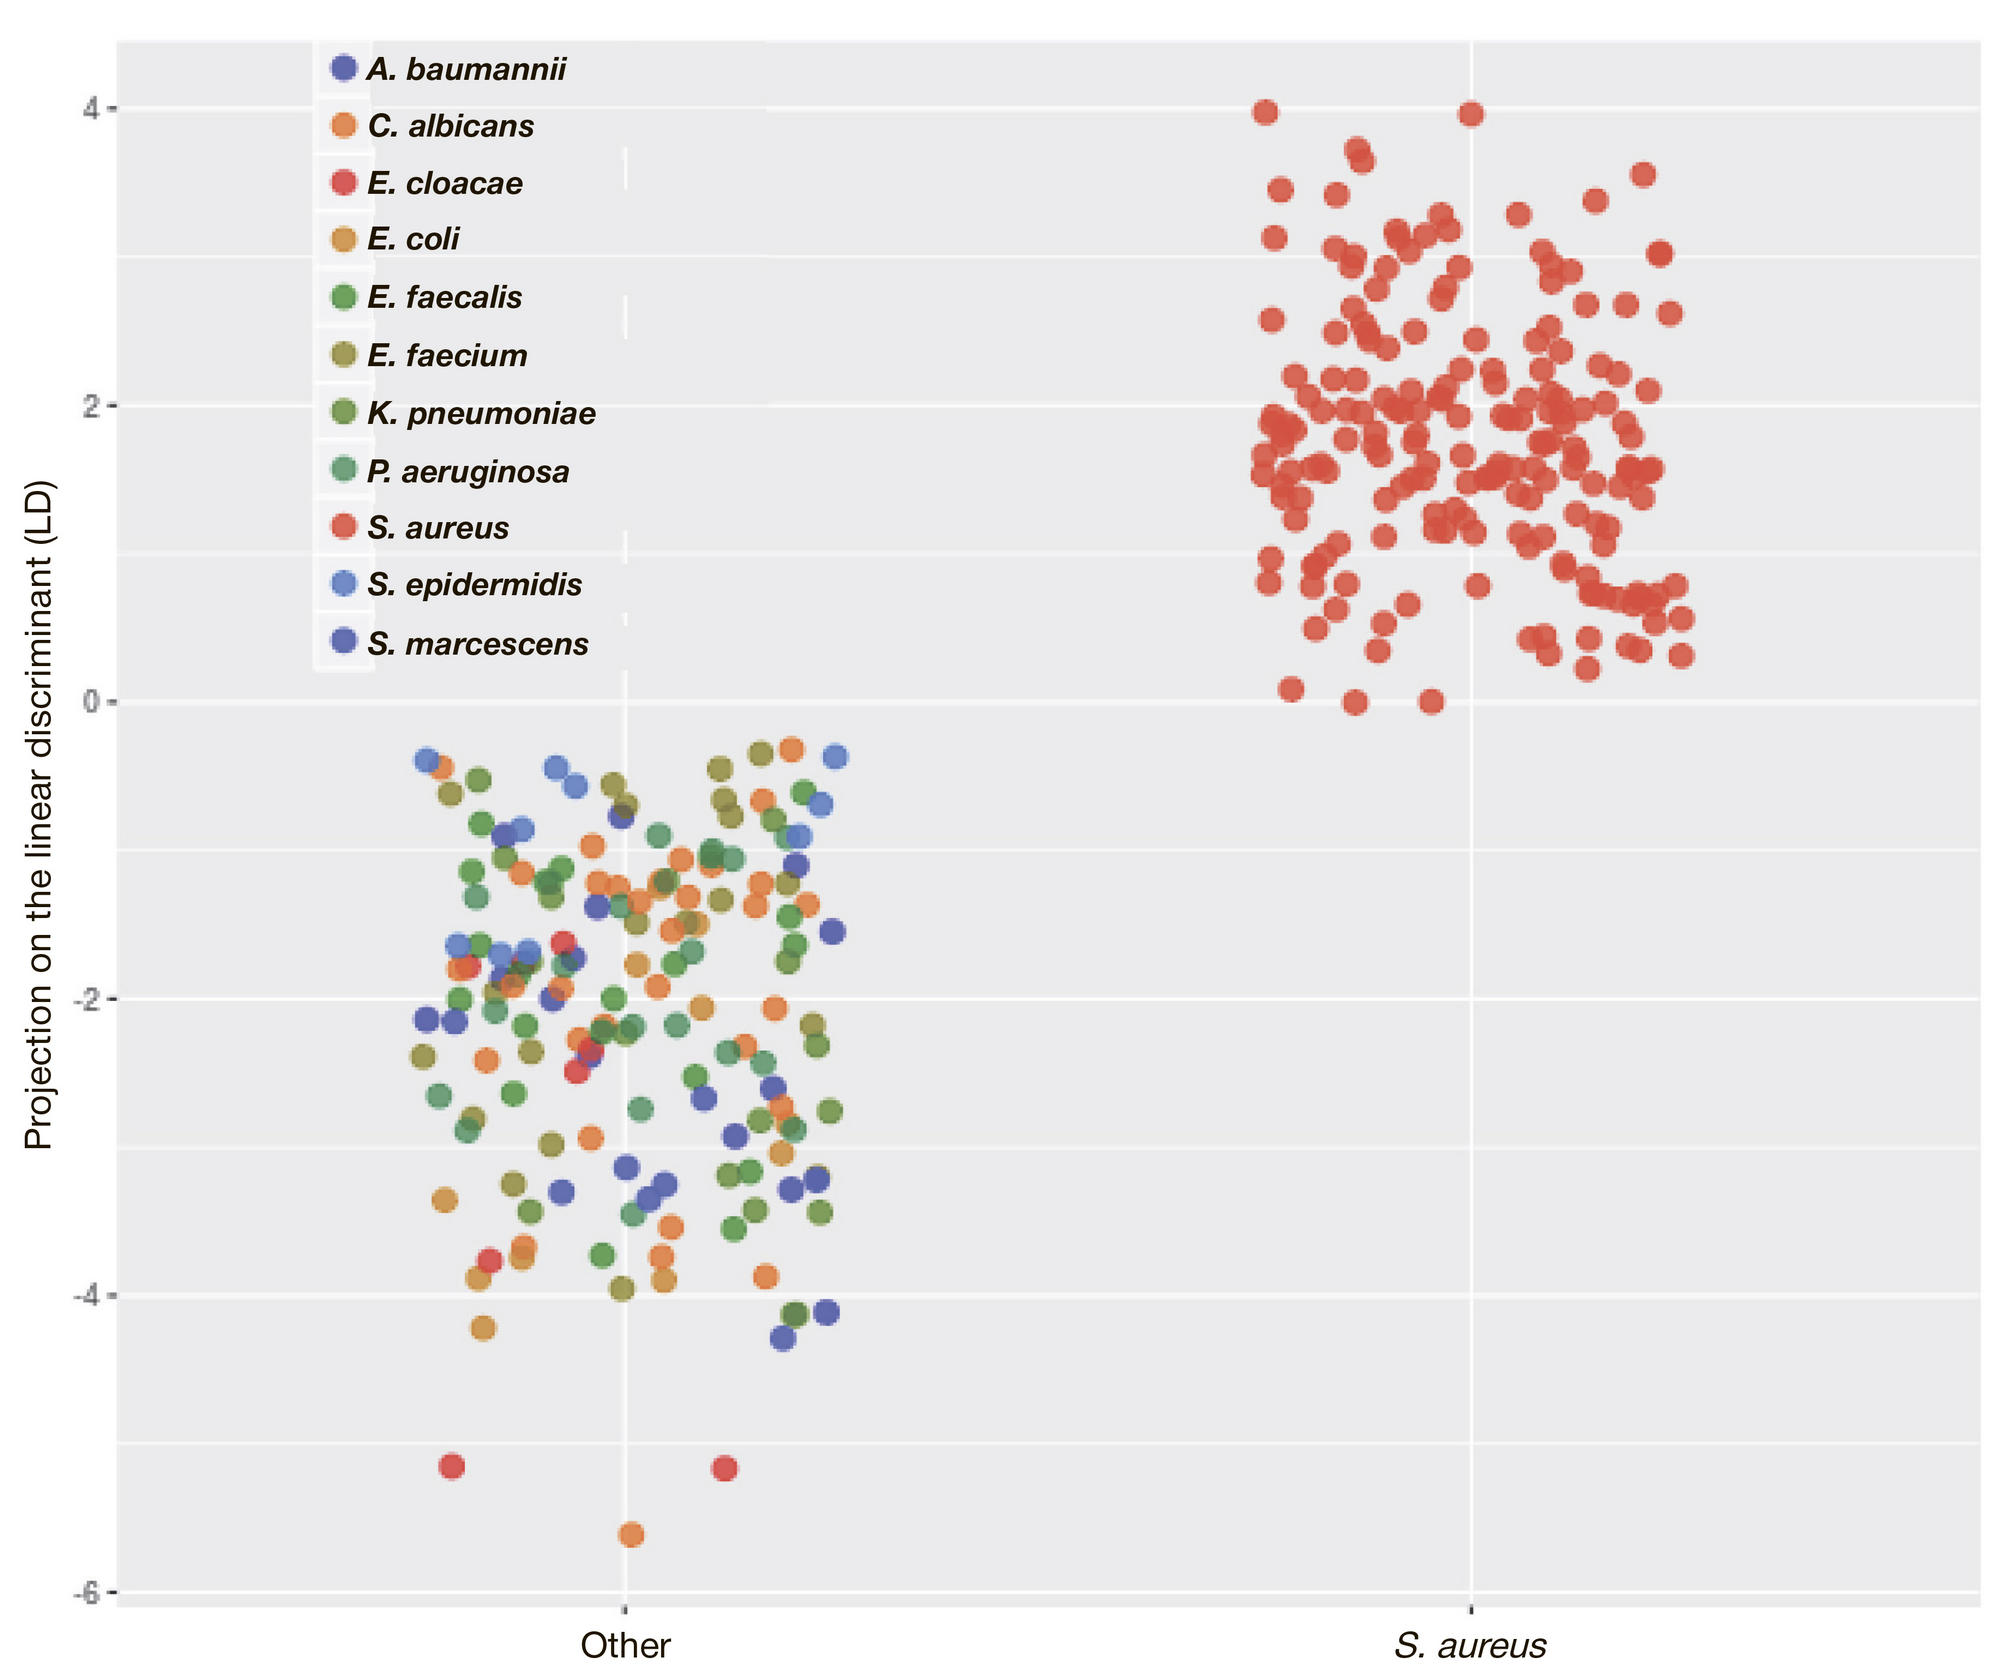
Fig. 3. Projection of the initial data onto the linear discriminant (LD) obtained by PCA-LDA. Pathogens are marked by different colors. For the sake of convenience, the spectra of the target pathogen S. aureus are separated from others on X-axis. The groups are well-separated given that LD > 0
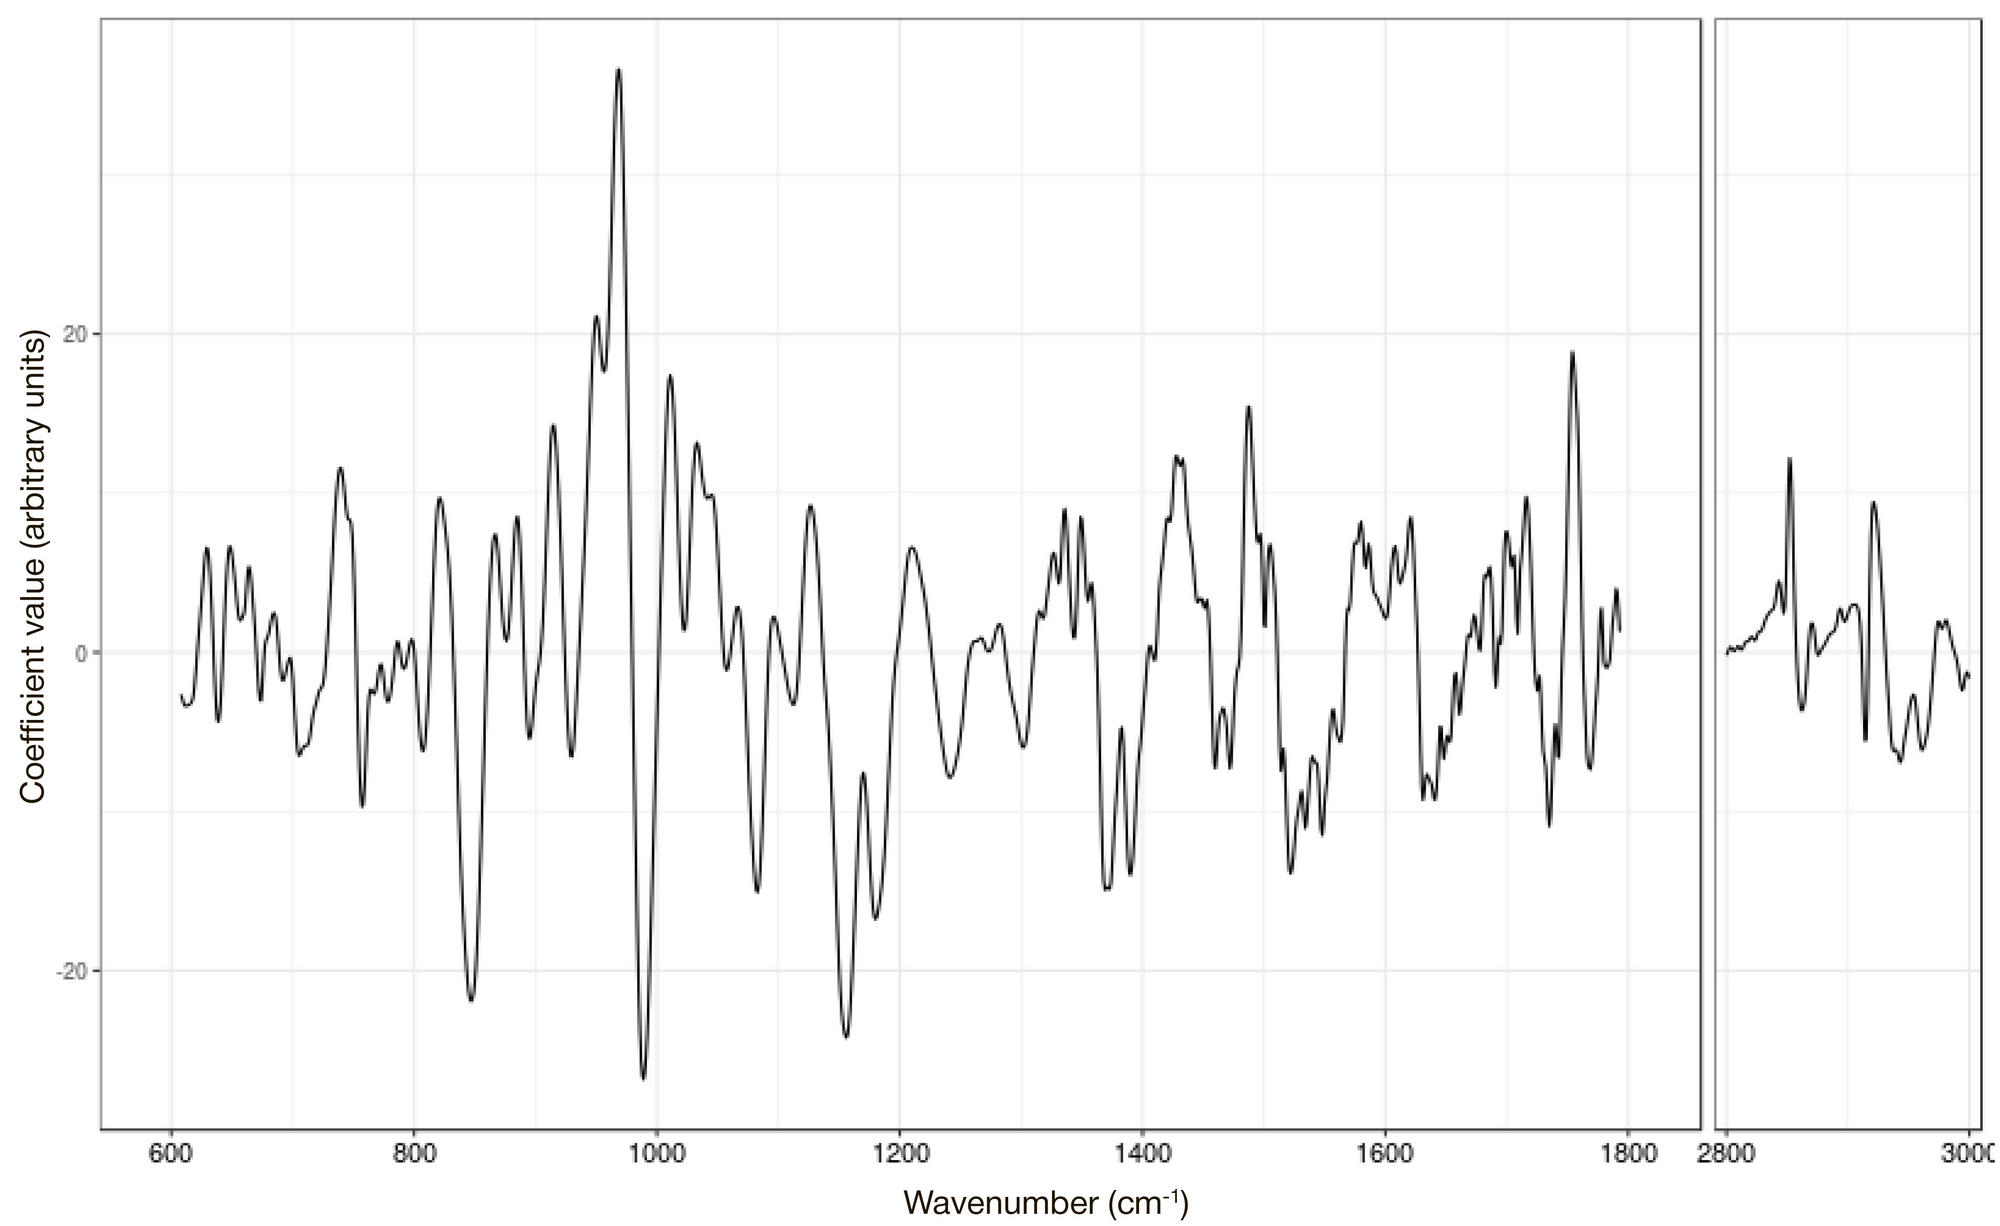
Fig. 4. Linear discriminant coefficients obtained by PCA-LDA. These coefficients were used to obtain the projections in Fig. 3. The coefficients represent the informative value of spectral data. For example, high values of the initial spectrum in the zone of negative coefficients indicate the probability that the studied isolate is not the pathogen of interest
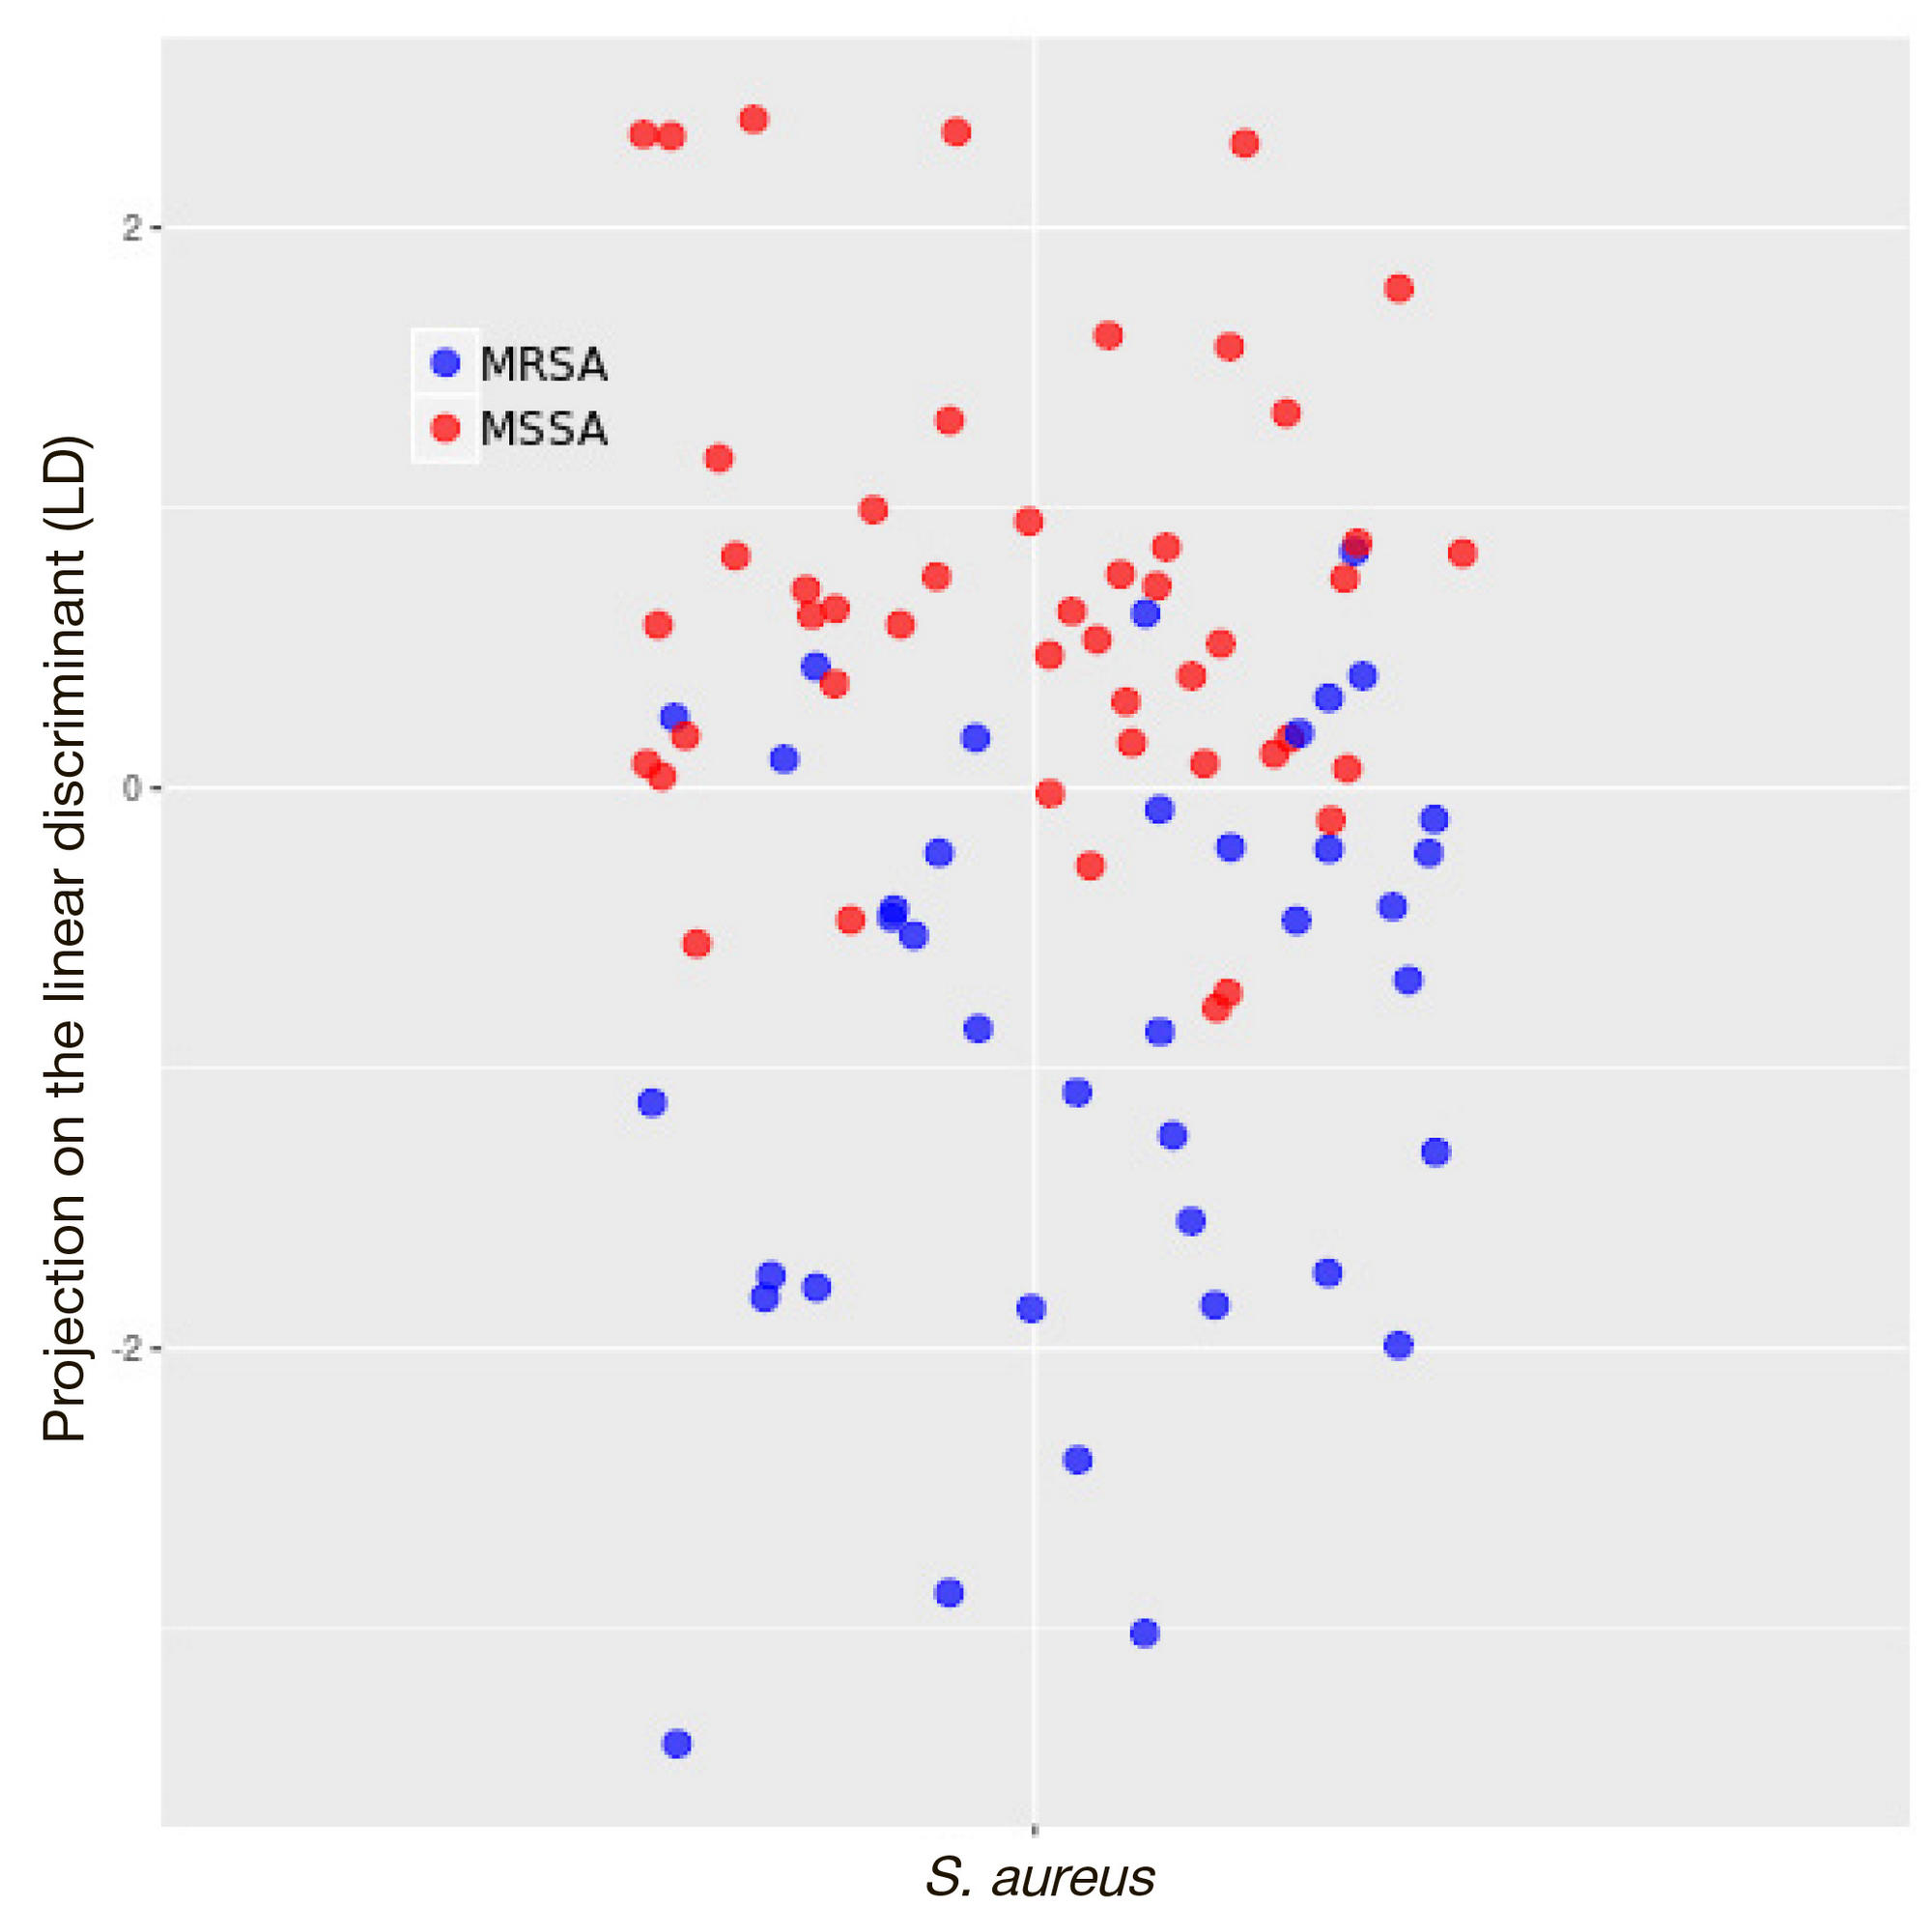
Fig. 5. Projection on the linear discriminant separating phenotypes MSSA and MRSA. Projections of MSSA spectra are shown in red; projections of MRSA spectra are shown in blue. Although 100% classification accuracy was not achieved, it was 80% given that LD > 0
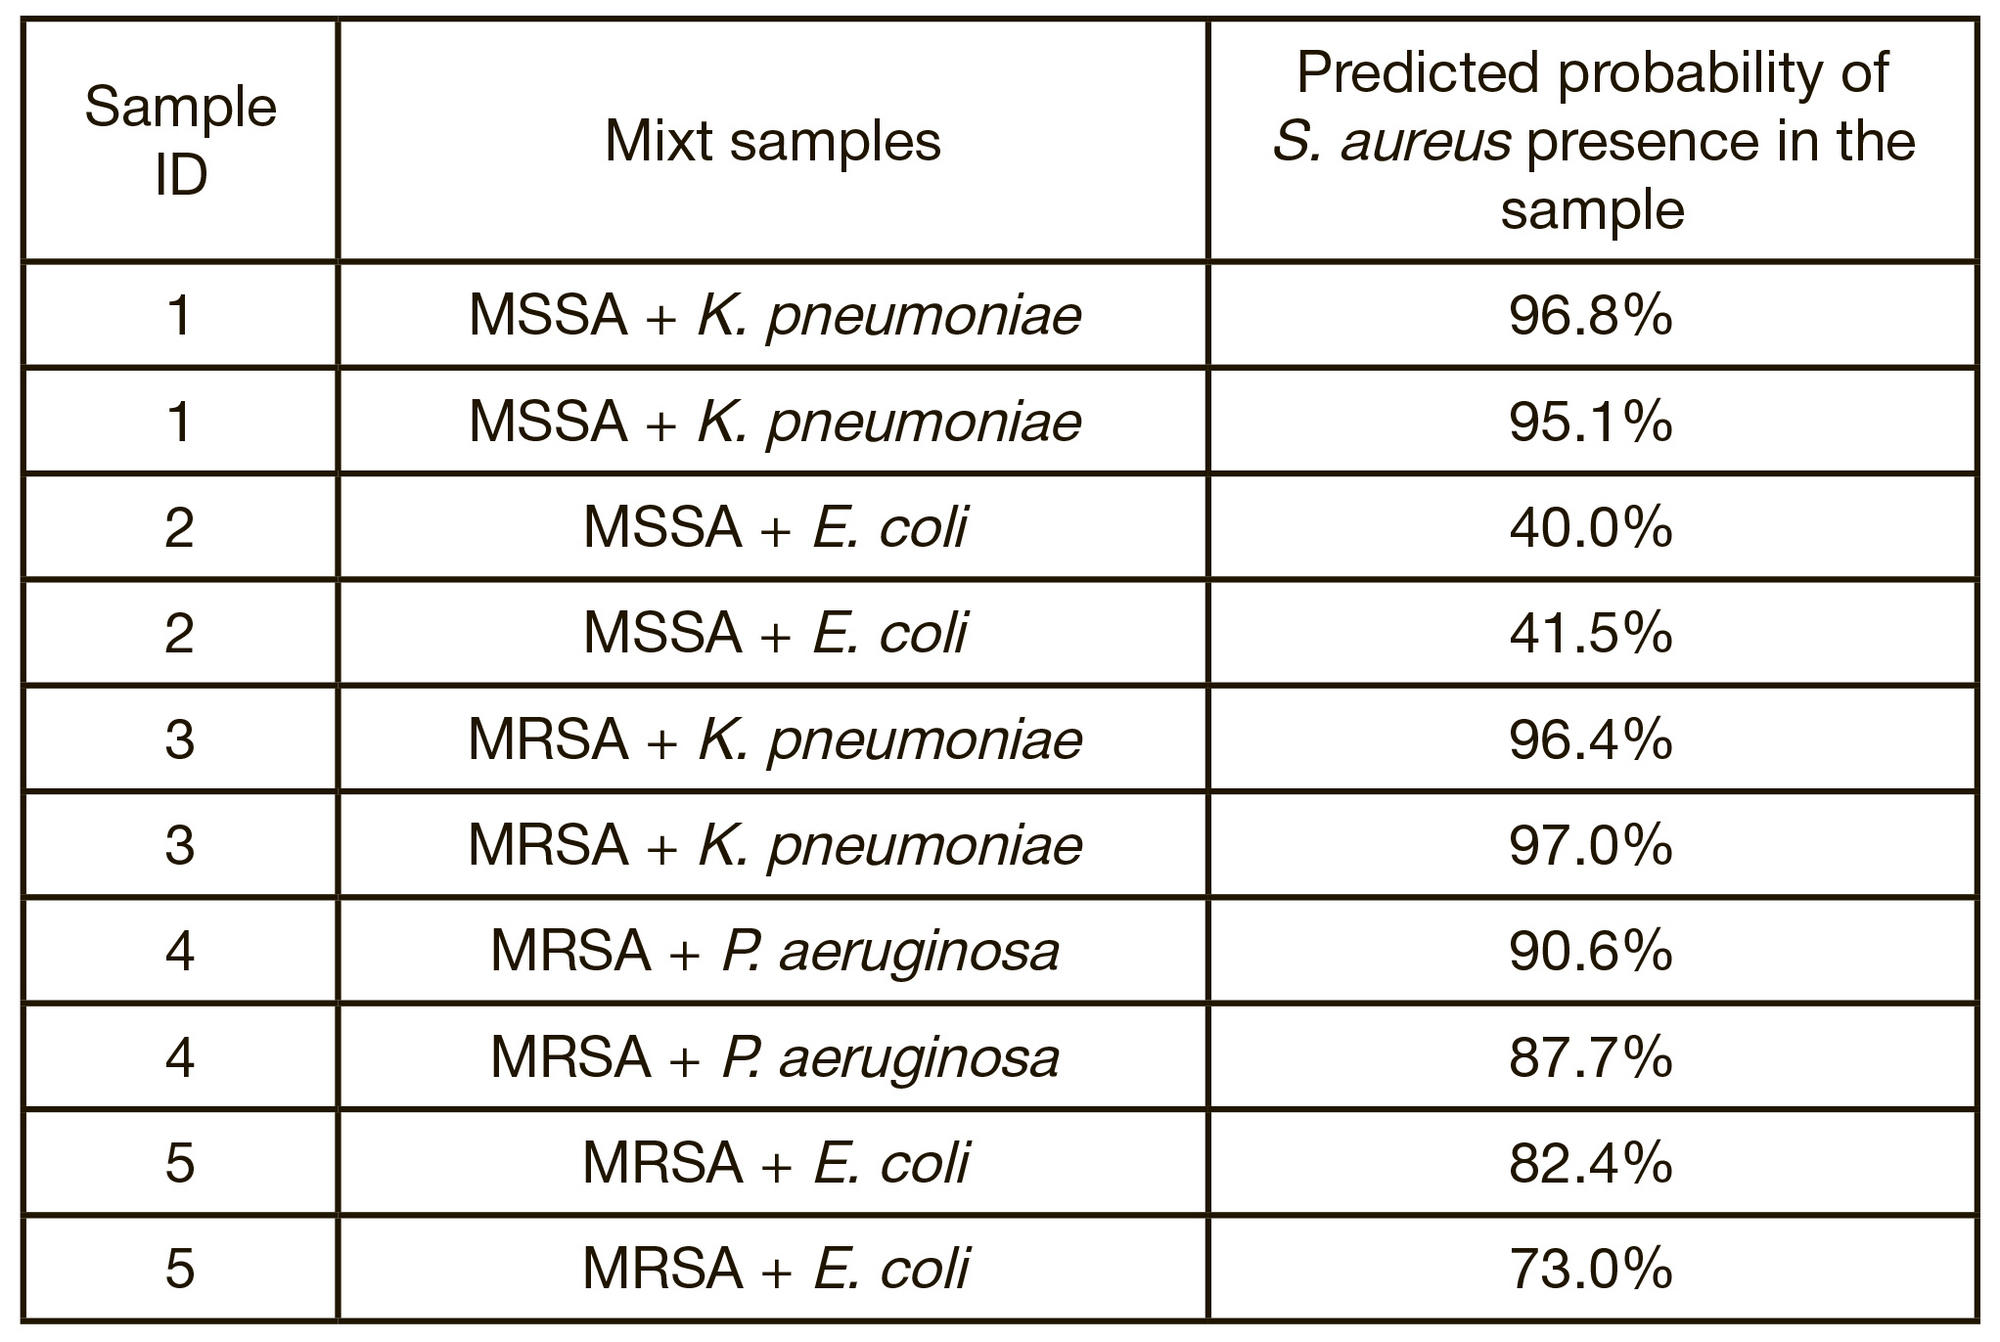
Table. Predicted probability of S. aureus presence in the sample