ORIGINAL RESEARCH

Molecular origin of surface-enhanced Raman spectra of E. coli suspensions excited at 532 and 785 nm using silver nanoparticle sols as sers substrates

Durovich EA1, Evtushenko EG1,2, Senko OV1, Stepanov NA1, Efremenko EN1, Eremenko AV2, Kurochkin IN1,2
About authors

1 Faculty of Chemistry, Lomonosov Moscow State University

2 Emanuel Institute of Biochemical Physics of the Russian Academy of Sciences, Moscow, Russia

Correspondence should be addressed: Evgeniy G. Evtushenko
Leninskie gory, 1 bl. 3, Moscow, 119991; ur.usm.mehc.emyzne@oknehsutve
Received: 2018-08-15 Accepted: 2018-09-09 Published online: 2018-12-31
|
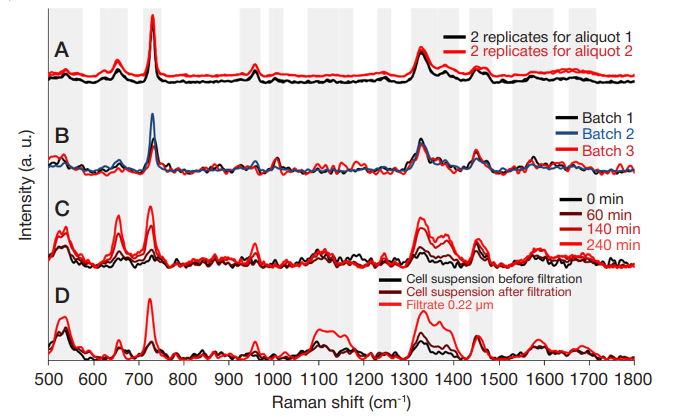
Fig. 1. SER spectra of E. coli suspensions at 785 nm excitation wavelength. А. Repeatability of measurements for one aliquot and one cell batch. B. Reproducibility of the spectra for different batches of cell suspensions. C. Dynamics of SER spectra over time observed in cells stored in water at +4 °С. D. Comparison of the spectra of the cell suspension and the filtrate (0.22 μm) of the same suspension. Vector normalization was applied to the spectra (A, B); the spectra (C, D) were not normalized to demonstrate the difference in their intensity. Ranges of spectral differences are shown in gray
Fig. 2. Changes in the SER spectra of E. coli suspensions (785 nm) following inactivation by heating. The spectra were not normalized to demonstrate the difference in their intensity
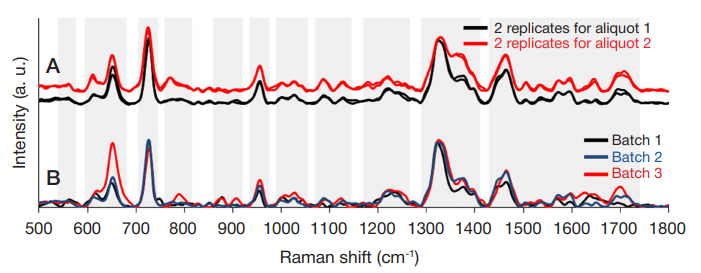
Fig. 3. SER spectra of E. coli suspensions at 532 nm excitation wavelength A. Repeatability of measurements for one aliquot and one cell batch. B. Reproducibility of the spectra for different batches of cell suspensions. Vector normalization was applied to the spectra. Ranges of spectral differences are shown in gray
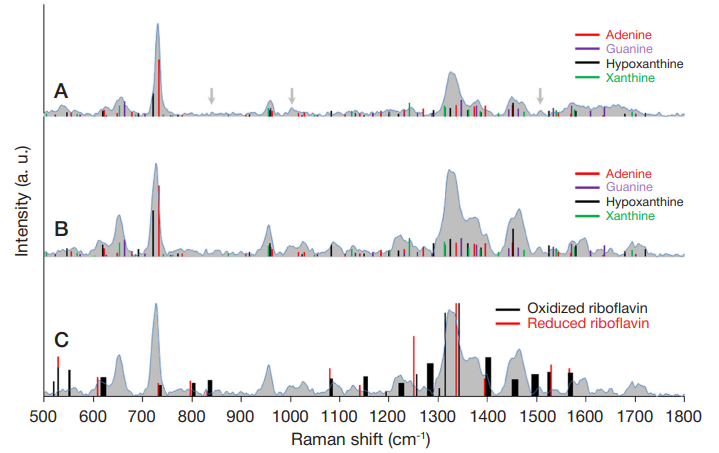
Fig. 4. Overlay of SER spectra corresponding to purine derivatives [16] and riboflavin [4, 24, 25] on the SER spectra of E. coli suspension A. Spectral bands of purine derivatives in the spectra of E. coli at 785 nm EW. Arrows mark uncharacterized low-intensity bands. B. Spectral bands of purine derivatives in the spectra of E. coli at 532 nm EW. C. Overlay of spectral bands of riboflavin on the spectra of E. coli at 532 nm EW. The width of riboflavin bands on the graph reflects the variability of their positions in literature sources
Table. The table shows all spectral bands observed in the SER spectra of E. coli including the filtrates of cell suspensions and their assignment to the purine metabolites whose spectra were characterized in [16]. A — adenine, G — guanine, Hx — hypoxanthine, X — xanthine