ORIGINAL RESEARCH

Telomerized fibroblasts as a candidate 3D in vitro model of pathological hypertrophic scars

Shadrin VS, Kozhin PM, Shoshina OO, Luzgina NG, Rusanov AL
About authors

Orekhovich Research Institute of Biomedical Chemistry, Moscow, Russia

Correspondence should be addressed: Valerian S. Shadrin
Pogodinskaya, 10, str. 8, Moscow, 119121; moc.liamg@nirdahsnairelav

About paper

Funding: this research was supported by the Russian Ministry of Science and Higher Education and was conducted under the Federal Targeted Program on Research and Development in Priority Fields of Science and Technology for 2014–2020 (Agreement 05.604.21.0219, Project ID RFMEFI60419X0219).

Author contribution: Luzgina NG, Rusanov AL conceived the study and proposed its design; Shadrin VS, Kozhin PM, Shoshina OO, Luzgina NG, Rusanov AL analyzed the literature, analyzed and interpreted the experimental data and wrote the manuscript; Shadrin VS, Kozhin PM planned and conducted the experiment; Shadrin VS wrote the manuscript.
Received: 2020-08-28 Accepted: 2020-09-02 Published online: 2020-09-27
|
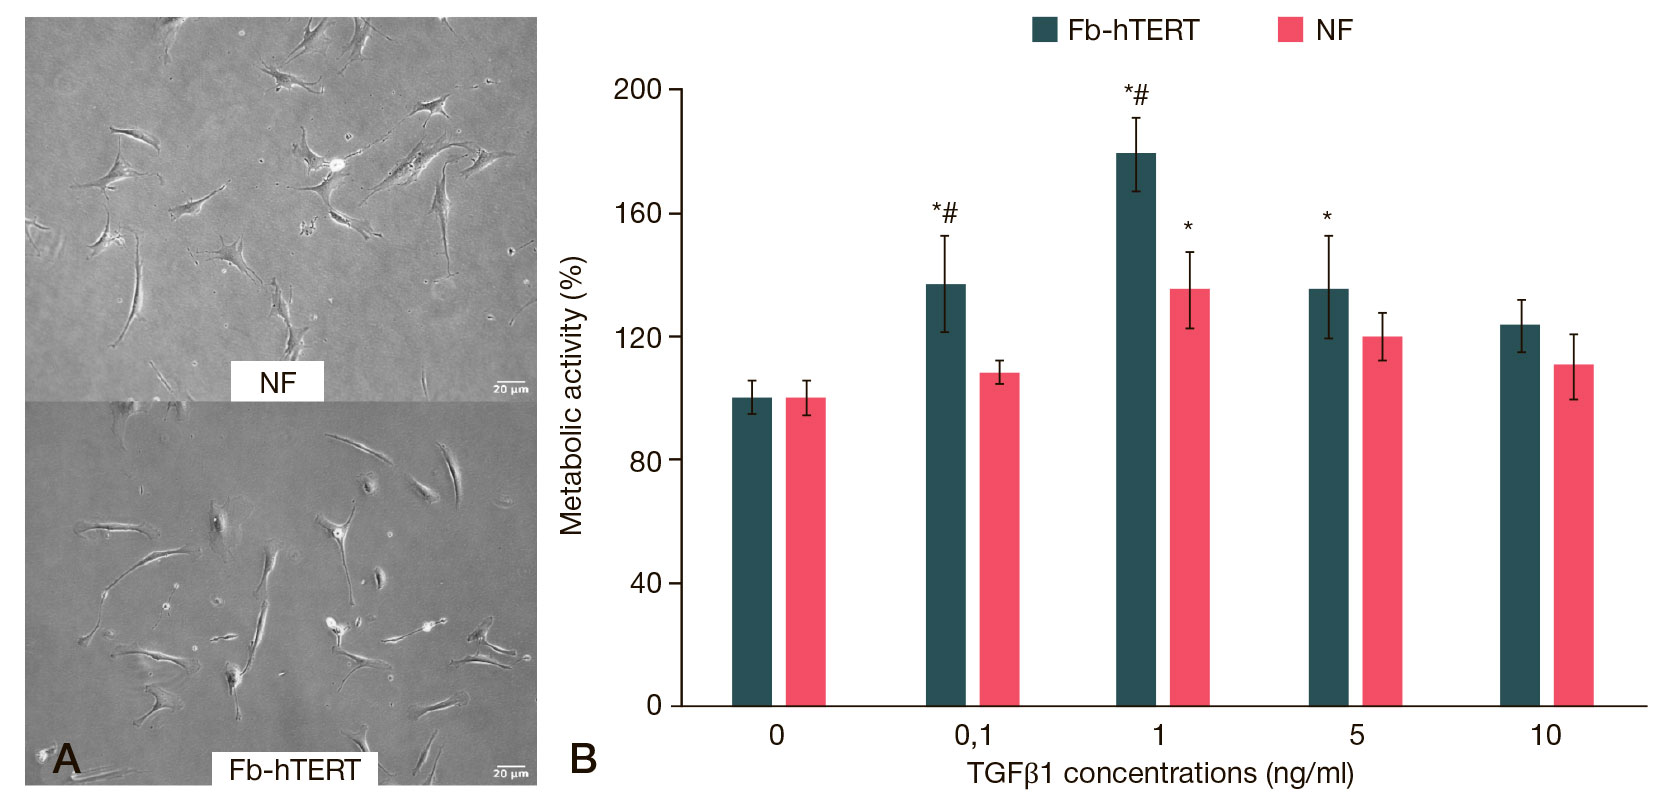
Fig. 1. Characteristics of NF and Fb-hTERT cells in a 2D-culture. A. The appearance of NF and Fb-hTERT cells. Light microscopy, ×100 magnification. B. The metabolic activity of NF and Fb-hTERT cells at different concentrations of TGFβ1 (the МТТ-assay). * — differences are significant relative to the previous TGFβ1 concentration (p < 0.05); # — differences are significant relative to NF cells at the same TGFβ1 concentration (p < 0.05). Note: hereinafter, NF stands for normal human foreskin fibroblast cells, Fb-hTERT stands for human skin telomerized postnatal fibroblasts
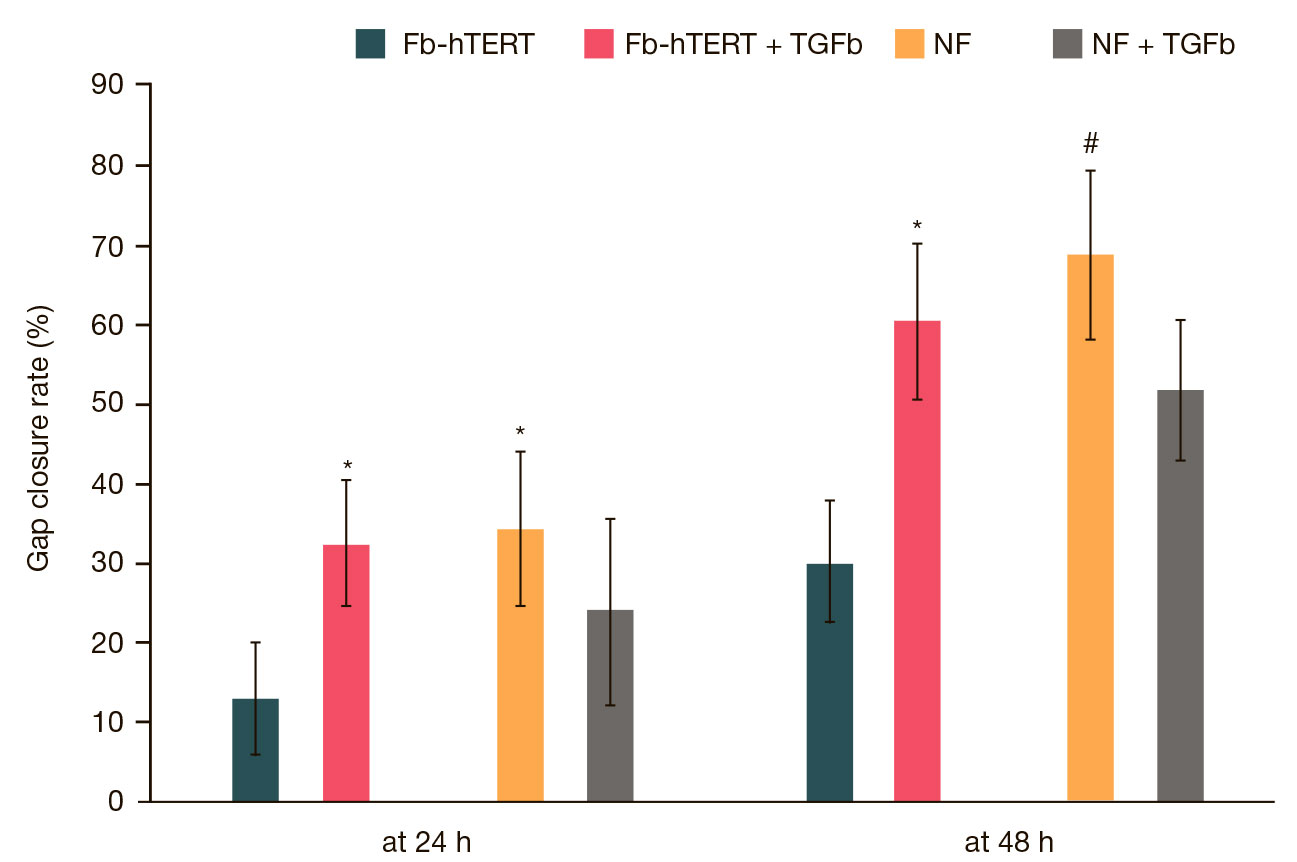
Fig. 2. Basal (control) and TGFβ1-stimulated gap closure rate in the monolayer of NF and Fb-hTERT cells (the scratch assay, TGFβ1 concentration in the culture medium is 1 ng/ml). * — differences are significant relative to the basal gap closure rate (p < 0.05); # — differences are significant relative to Fb-hTERT cells under the same culture conditions (p < 0.05)
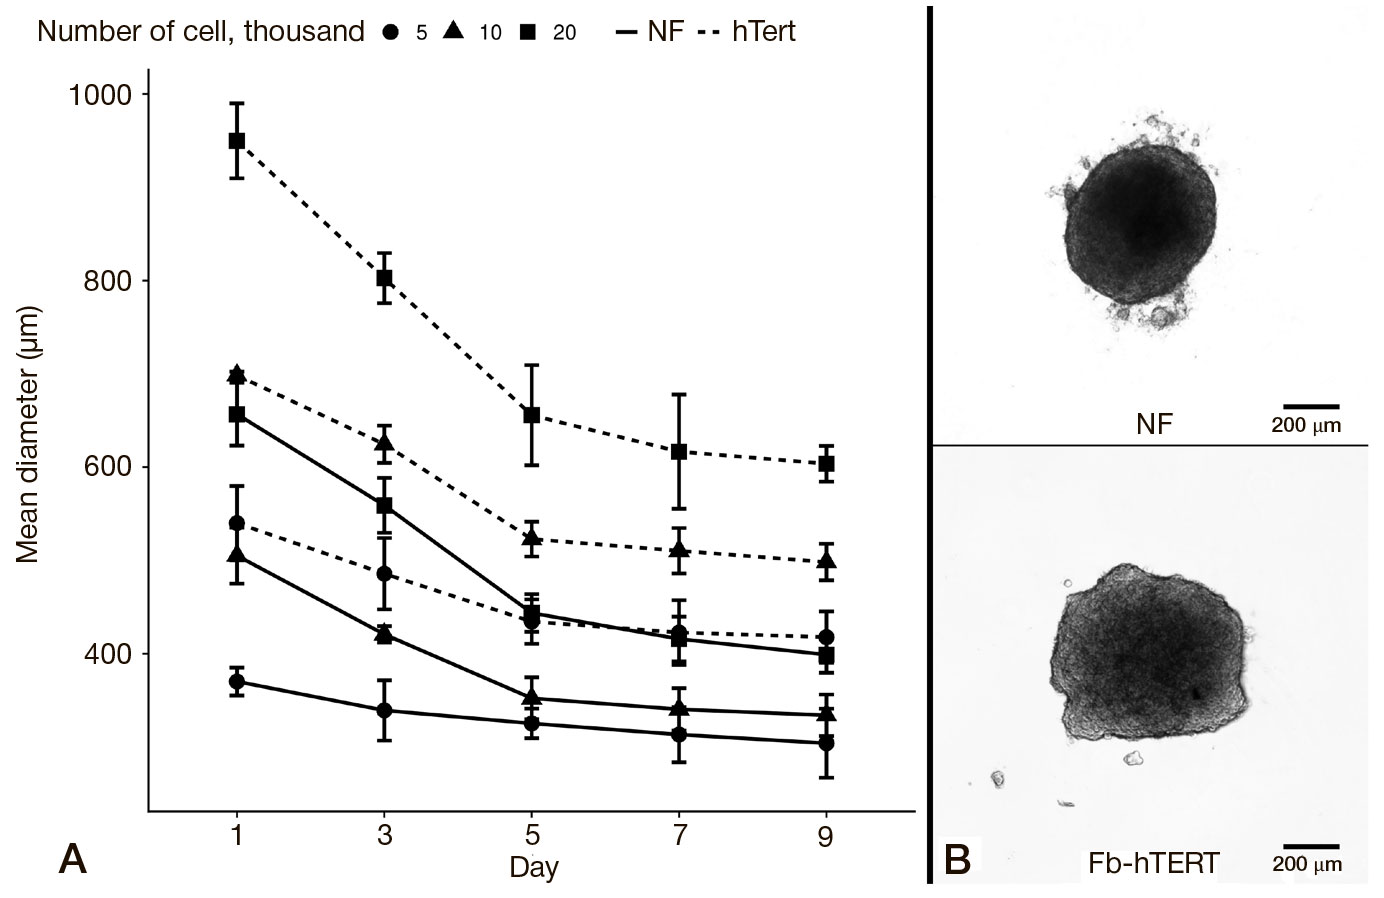
Fig. 3. Growing spheroids from NF and Fb-hTERT cells. A. Changes in the mean spheroid diameter grown from initially different numbers of NF and Fb-hTERT cells (M ± σ). B. The appearance of an NF spheroid (20,000 cells) and an Fb-hTERT spheroid (10,000 cells). Light microscopy, ×40 magnification
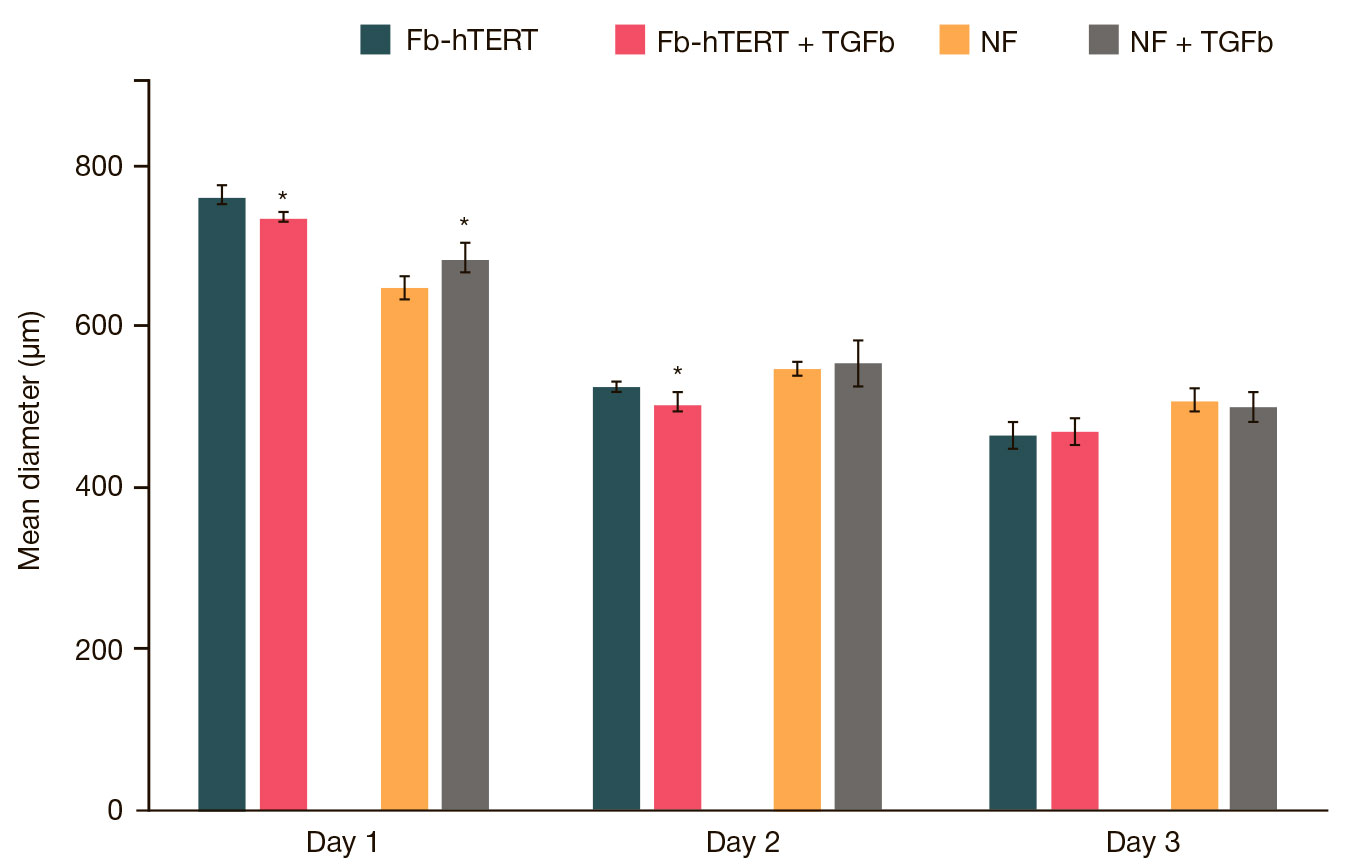
Fig. 4. The mean diameter of spheroids grown from NF and Fb-hTERT at different incubation times in the presence of 1 ng/ml TGFβ1 in the culture medium and in the absence of this growth factor (control). In order to obtain spheroids comparable in their size, we used 20,000 NF and 10,000 Fb-hTERT cells, respectively. * — differences are significant relative to the control group at the same time point (p < 0.05)
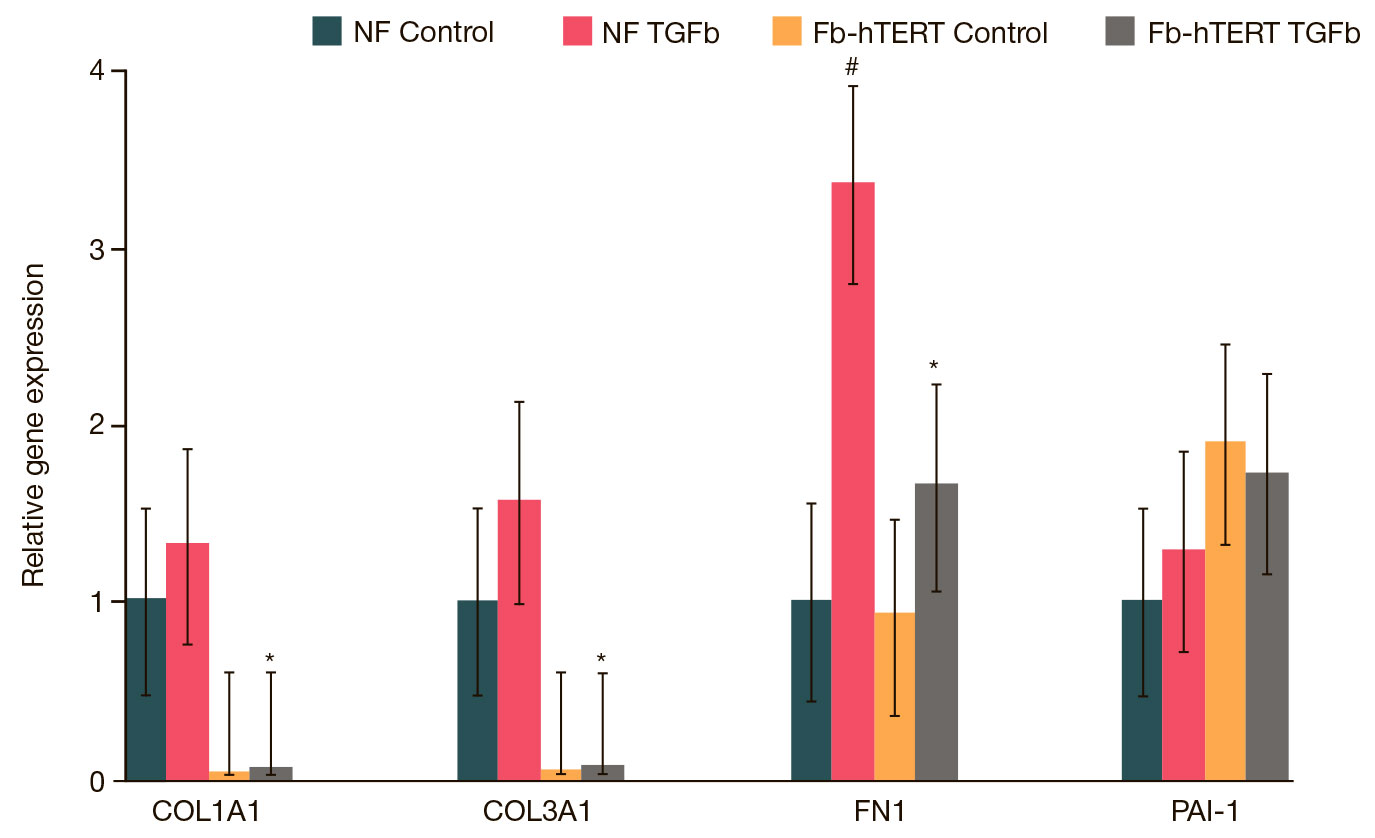
Fig. 5. Expression of genes associated with fibrous tissue growth in NF and Fb-hTERT cells in the absence and presence of TGFβ1 (1 ng/ml). * — differences are significant between Fb- hTERT and NF cells in the presence of TGFβ1 (p < 0.05); # — differences are significant between the 2 cell lines in the absence and in the presence of TGFβ1 (p < 0.05)
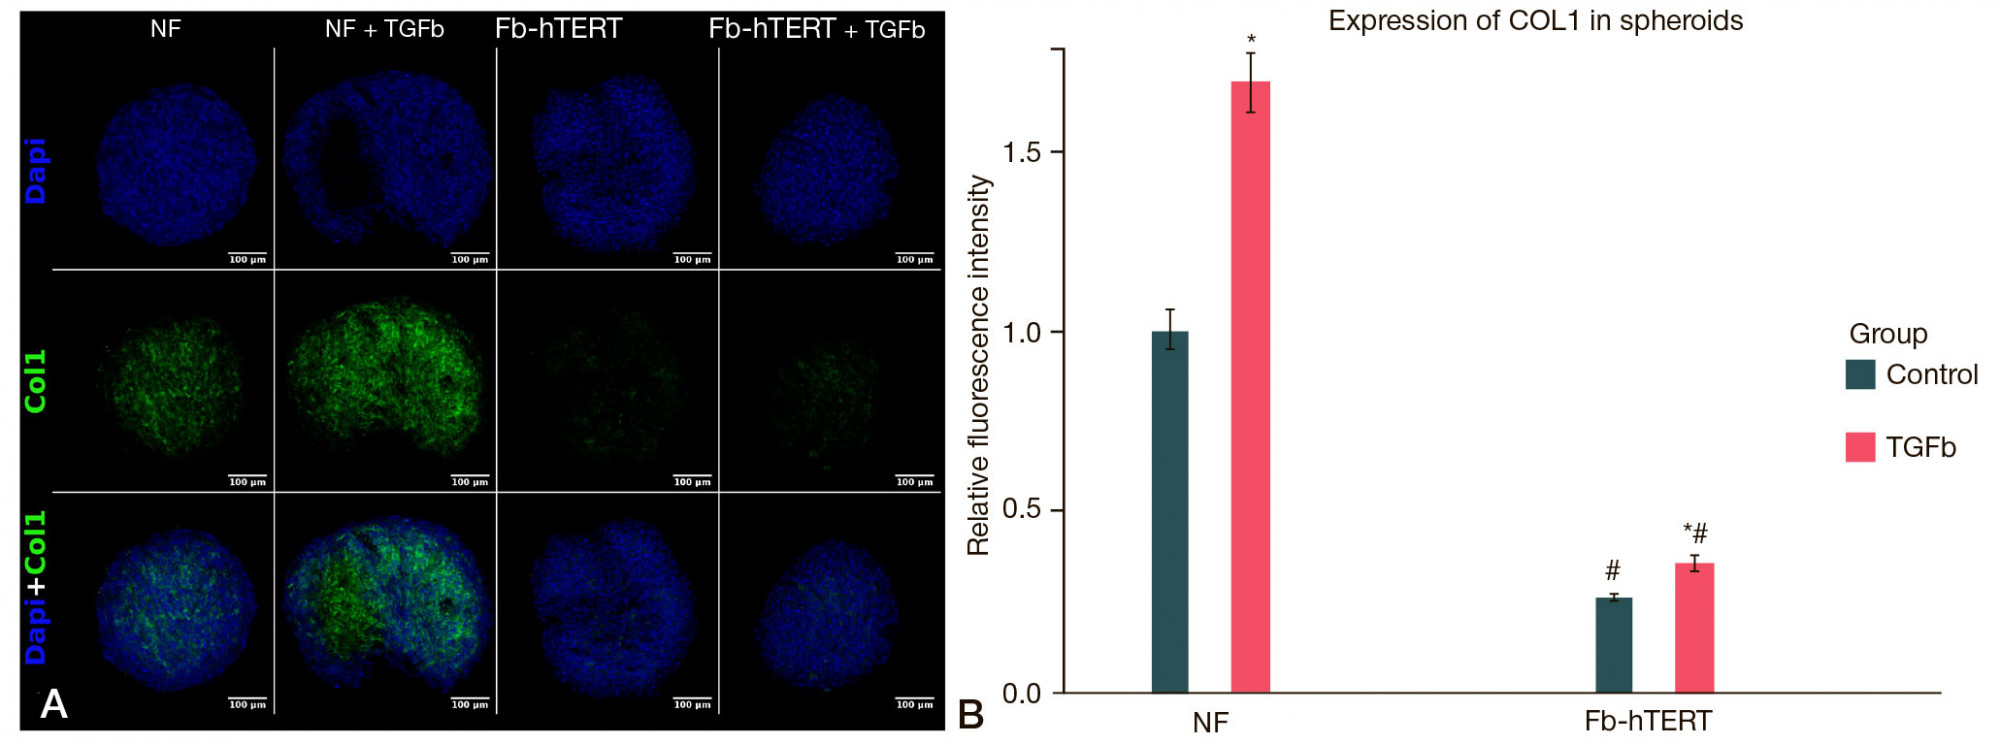
Fig. 6. Collagen I production in the spheroids grown from NF and Fb-hTERT cells in the presence of 1 ng/ml TGFβ1. А. Immunofluorescence assay, laser confocal microscopy, ×100 magnification; cell nuclei are stained blue (Dapi), collagen I is stained green. B. Relative fluorescence intensity of collagen I in the spheroids formed by NF and Fb-hTERT cells in the presence of 1 ng/ml TGFβ1. * — indicates statistically significant differences in collagen I fluorescence intensity in spheroids cultured in the presence or absence of TGFβ1 (p < 0.05); # — indicates statistically significant differences in collagen I fluorescence intensity between Fb-hTERT spheroids and NF spheroids in the presence of TGFβ1 (p < 0.05)