ORIGINAL RESEARCH

Structural and functional biomarkers of efficacy of navigated repetitive transcranial magnetic stimulation in therapy for trigeminal neuralgia

About authors

Research Center of Neurology, Moscow, Russia

Correspondence should be addressed: Alexandra G. Poydasheva
Volokolamsckoe shosse, 80, Moscow, 125367; ur.ygoloruen@avehsadyop

About paper

Author contribution: Poydasheva AG, Bakulin IS, Suponeva NA designed and planned the study; Poydasheva AG analyzed the literature; Poydasheva AG, Sinitsyn DO collected and analyzed the obtained data, wrote the draft version of the manuscript; All authors participated in editing the manuscript.

Compliance with ethical standards: the study was approved by the local Ethics Committee of the Research Center of Neurology (Protocol № 9–4/16 dated October 5, 2016) and complied with the Declaration Helsinki; informed consent was obtained from all study participants.
Received: 2021-05-18 Accepted: 2021-06-12 Published online: 2021-06-12
|
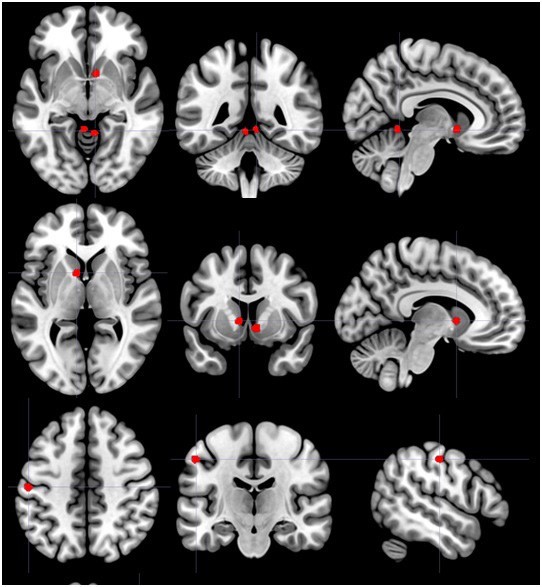
Fig. 1. Brain areas in which grey matter volume is positively correlated with the reduction in peak or average pain intensity (p(unc) < 0.05)
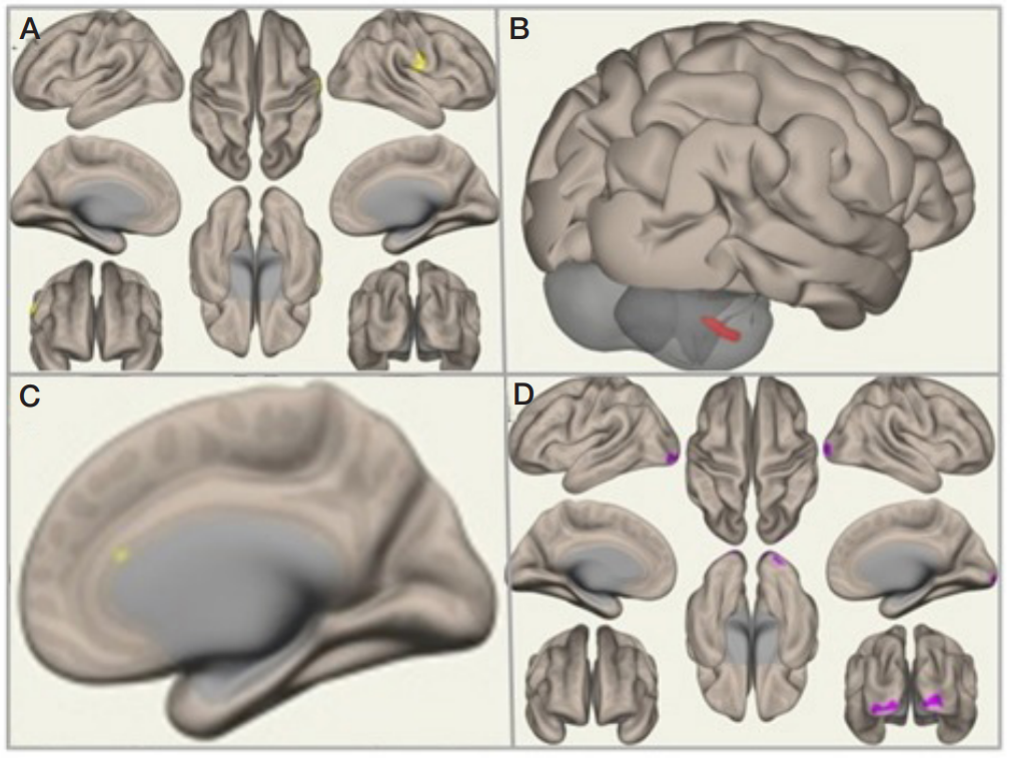
Fig. 2. Brain areas for which FC is correlated with the reduction in average pain intensity (p(FWE) < 0.05). A. Thalamus contralateral to pain side. B. Subcallosal gyrus contralateral to pain side. C. Cingulate gyrus ipsilateral to pain side. D. Putamen ipsilateral to pain side
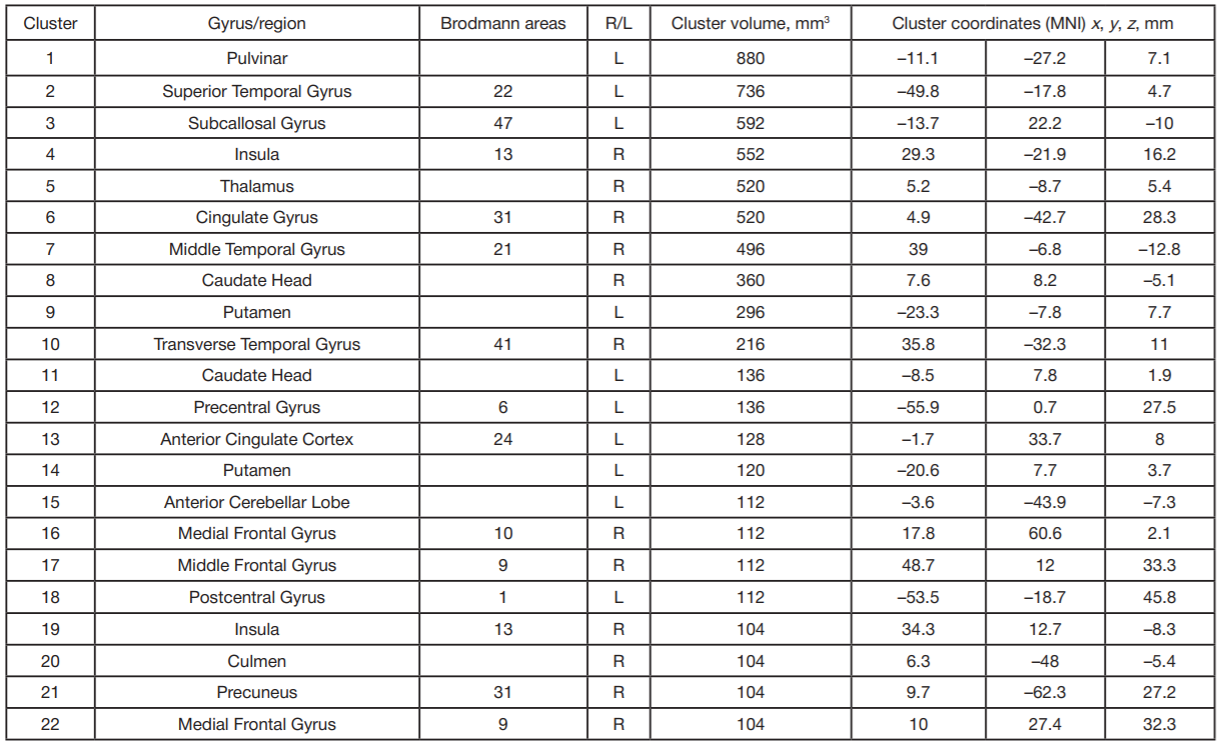
Table 1. Areas of interest (Henssen et al., 2019) selected for the analysis of clinical and neuroimaging correlations between the strength of response evoked by rTMS and structural/functional features of the brain
Note: R — right hemisphere; L — left hemisphere.
Table 2. Correlations between grey matter volume and rTMS effect
Note: C — the area of interest is localized to the hemisphere contralateral to pain side; I — the area of interest is localized to the hemisphere ipsilateral to pain side.
Table 3. Correlations between the functional connectivity of brain regions and rTMS effect on average pain intensity. The table features cluster-wise FWE-corrected p values for the areas of interest on each connectivity map, uncorrected for the number of such zones (clusters with p(FWE) < 0.05)
Note: C — the area of interest is localized to the hemisphere contralateral to pain side; I — the area of interest is localized to the hemisphere ipsilateral to pain side.