ORIGINAL RESEARCH

Models of mitochondrial dysfunction with inducible expression of Polg pathogenic mutant variant

Kubekina MV1, Kalinina AA2, Korshunova DS1, Bruter AV1, Silaeva YY1
About authors

1 Institute of Gene Biology, Moscow, Russia

2 Blokhin Russian Cancer Research Center, Moscow, Russia

Correspondence should be addressed: Marina V. Kubekina
Beskudnikovsky bulvar, 32, korpus 1, Moscow, 127474, Russia; moc.liamg@ymukyram

About paper

Funding: the study was supported by Russian Foundation for Basic Research, RFBR Project № 19-34-90073.

Author contribution: Kubekina MV — literature analysis, experimental research, data analysis and interpretation, oligo design, manuscript writing; Kalinina AA, Korshunova DS — experimental research; Bruter AV — literature analysis, research planning, data analysis and interpretation; Silaeva YY — literature analysis, research planning, data analysis and interpretation, scientific editing of the manuscript.

Compliance with ethical standards: the study was approved by Ethical Review board at the Institute of Gene Biology (Protocol of 05 December 2021) and carried out in strict compliance with the Directive 2010/63/EU of the European Parliament and of the Council of 22 September 2010 on the protection of animals used for scientific purposes.
Received: 2022-04-14 Accepted: 2022-04-28 Published online: 2022-04-27
|
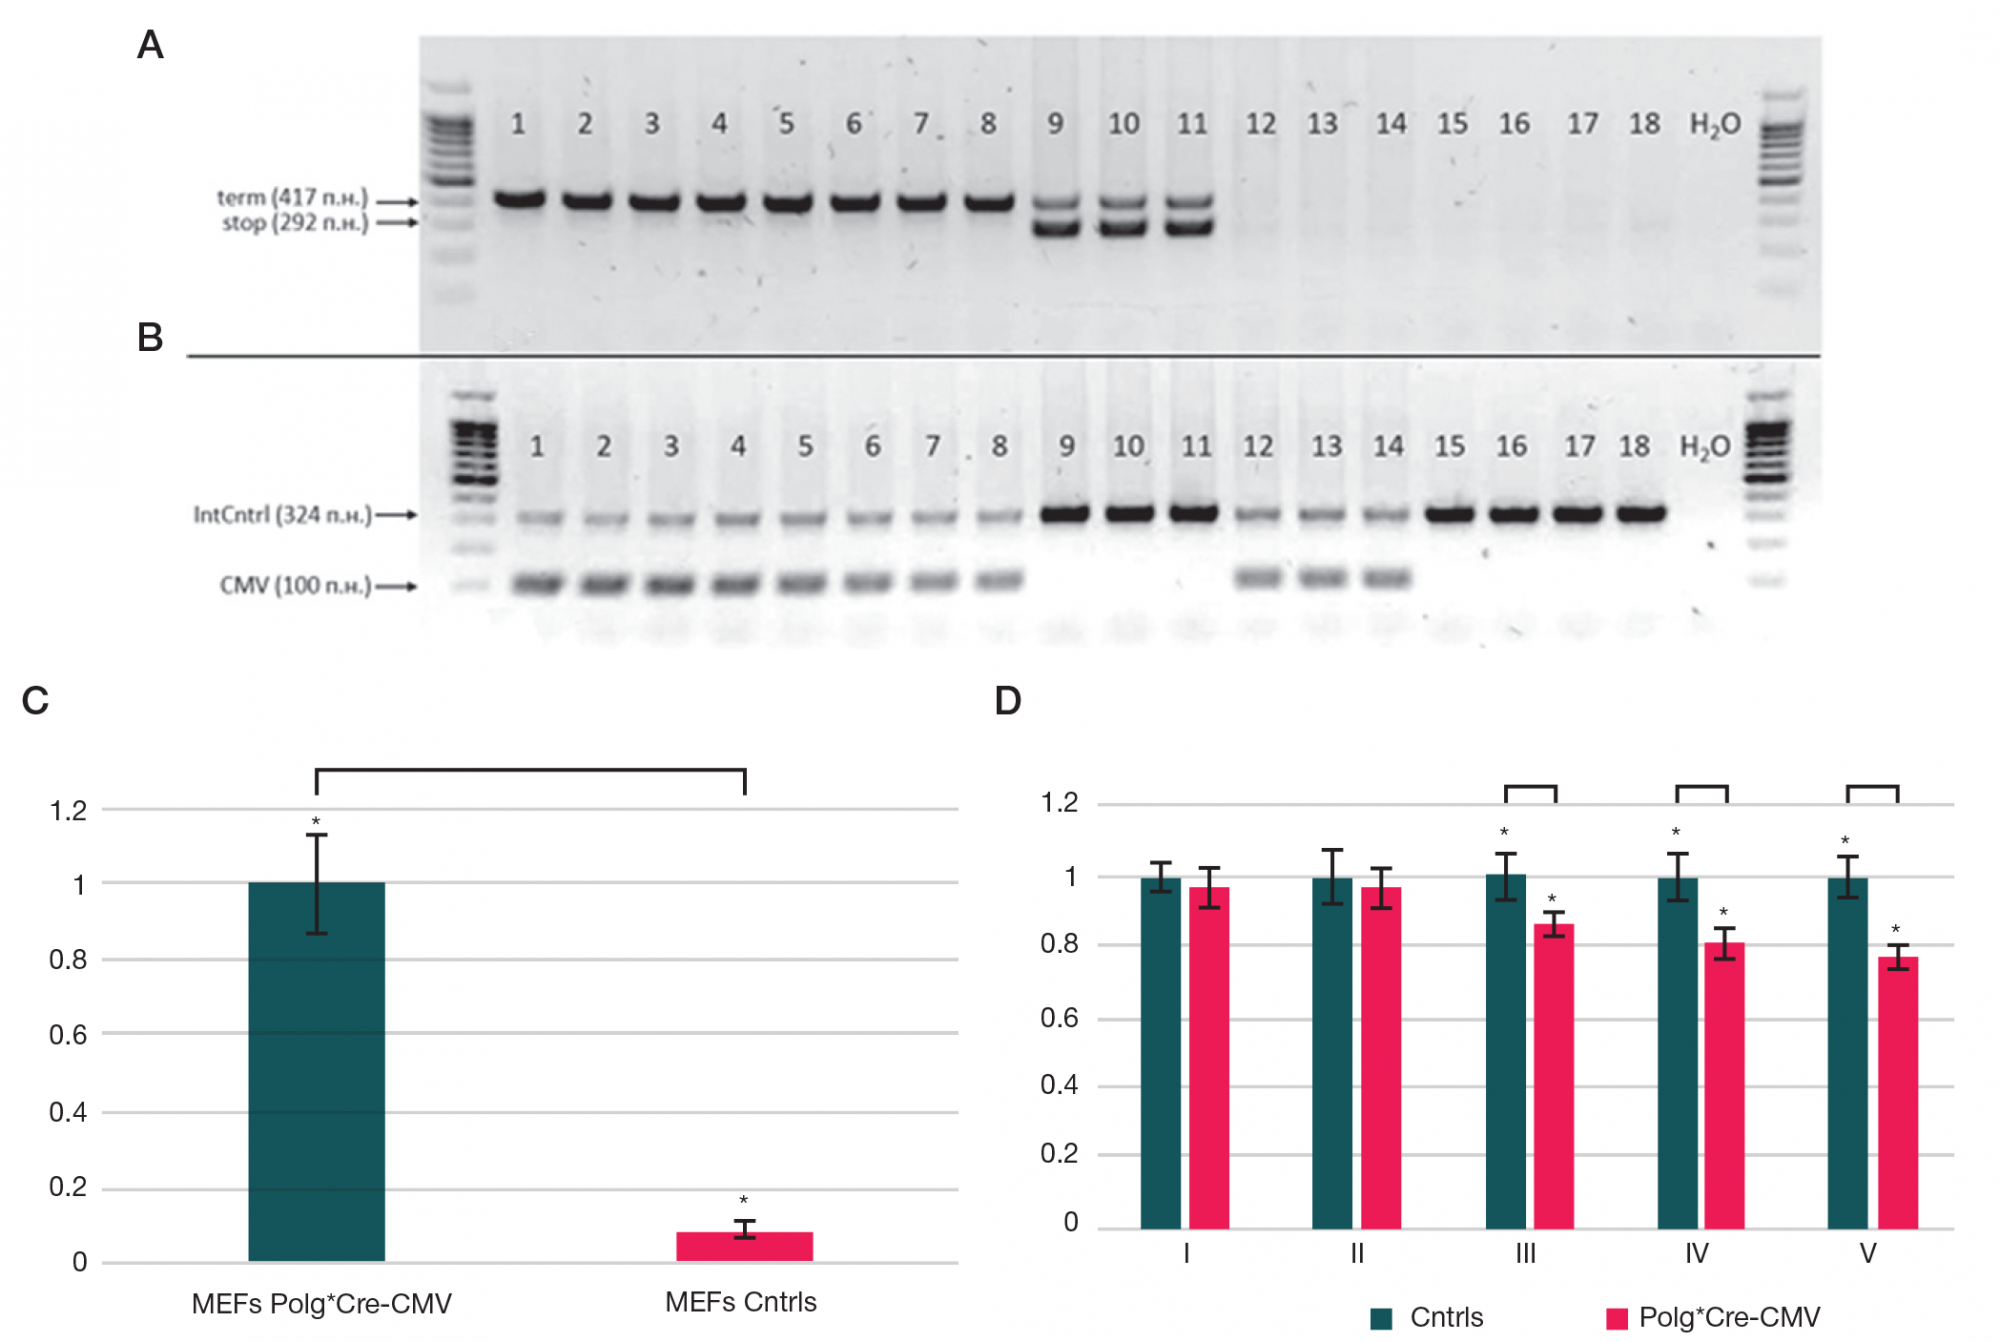
Fig. 1. Genotyping bands and group-wise histograms of Polg mutant variant expression and mitochondrial membrane potential in MEF cultures. A. Genotyping for STOP-cassette (292 bp) and terminator (417 bp). B. Genotyping for CMV (100 bp) and internal control (324 bp). C. Expression of the mutant variant in Polg*Cre-CMV, Polg, CMV-Cre, and wild-type (WT) MEF cultures. Expression of the mutant variant in Polg*Cre-CMV cultures was used as a basis (=1.0) to calculate expression levels for other genotypes, and the Polg, CMV-Cre, and WT levels were averaged. D. Serial measurements of the mitochondrial membrane potential in MEF cultures over 5 weeks of culturing. The measurements for Polg, CMV-Cre, and WT control cultures were averaged and used as a basis (=1.0) to calculate the mitochondrial membrane potential for Polg*Cre-CMV cultures. * — significant differences
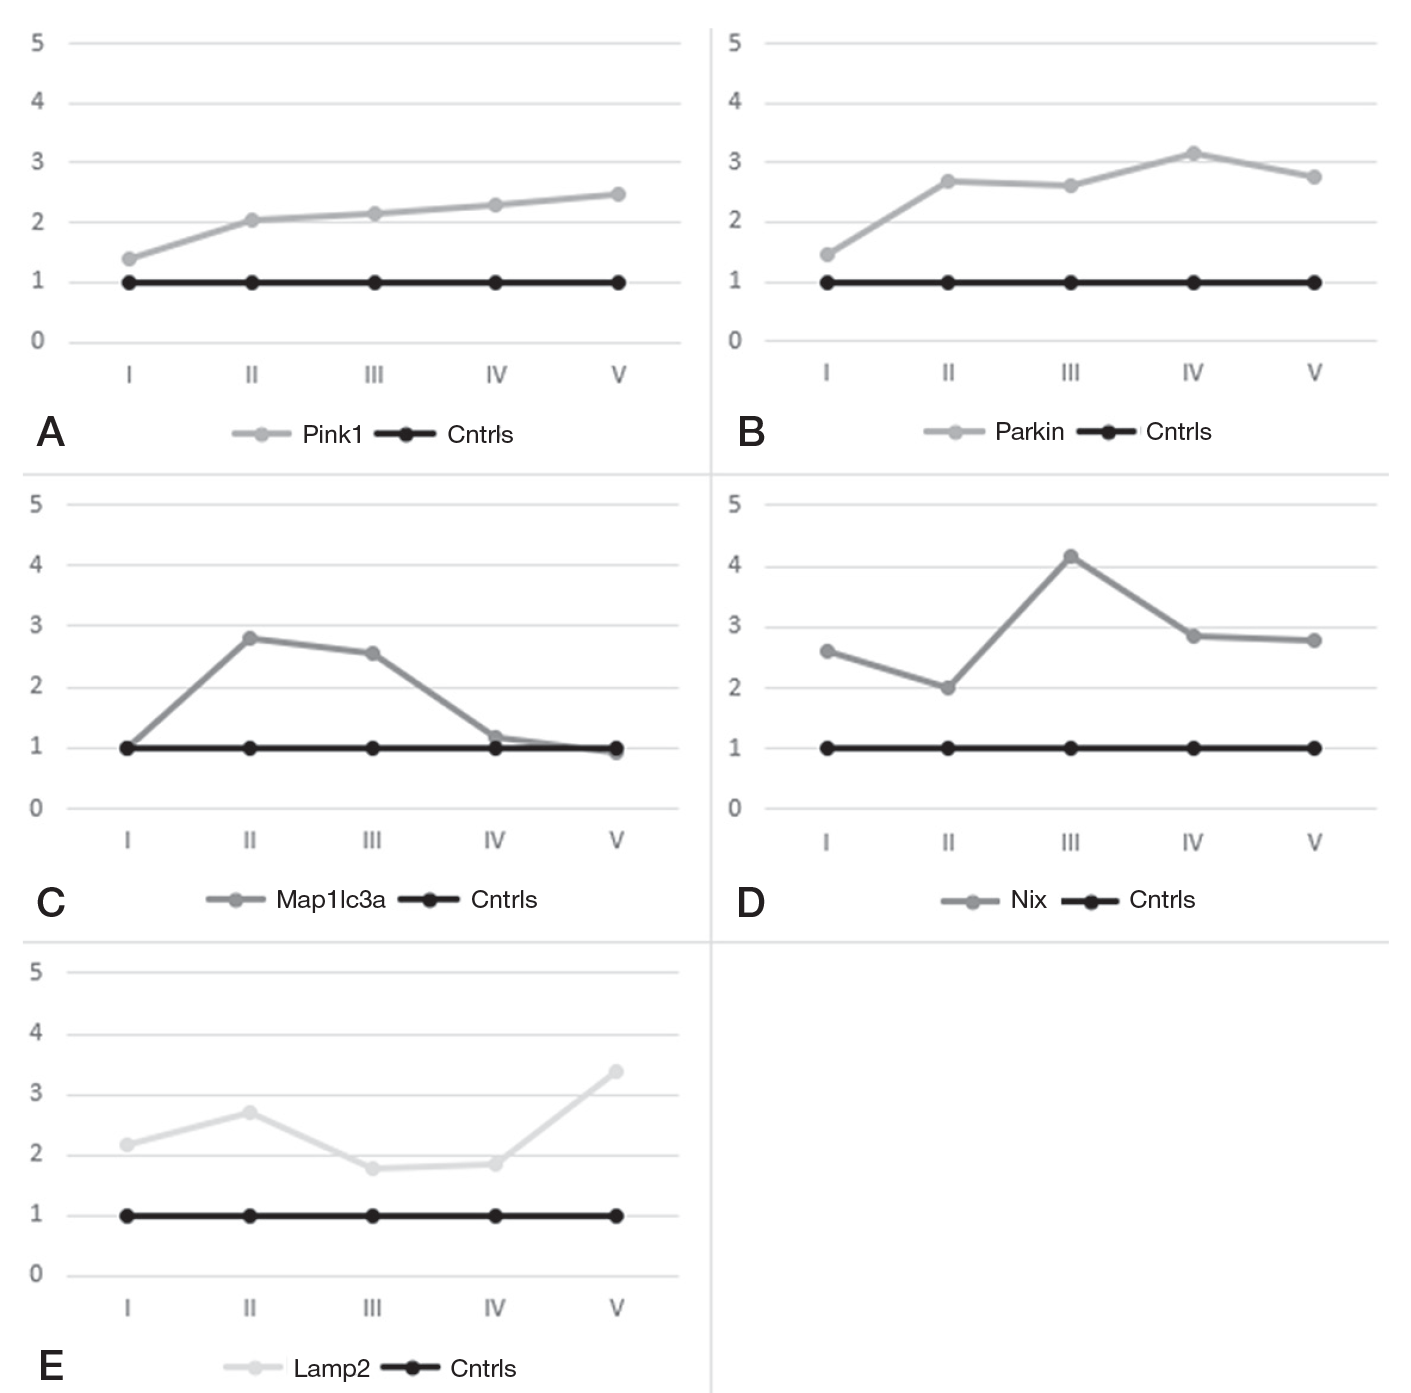
Fig. 2. Expression of mitophagy markers Pink1 (A), Parkin (B), Map1lc3a (C), Nix (D), and Lamp2 (E) in MEFs over 5 weeks of culturing
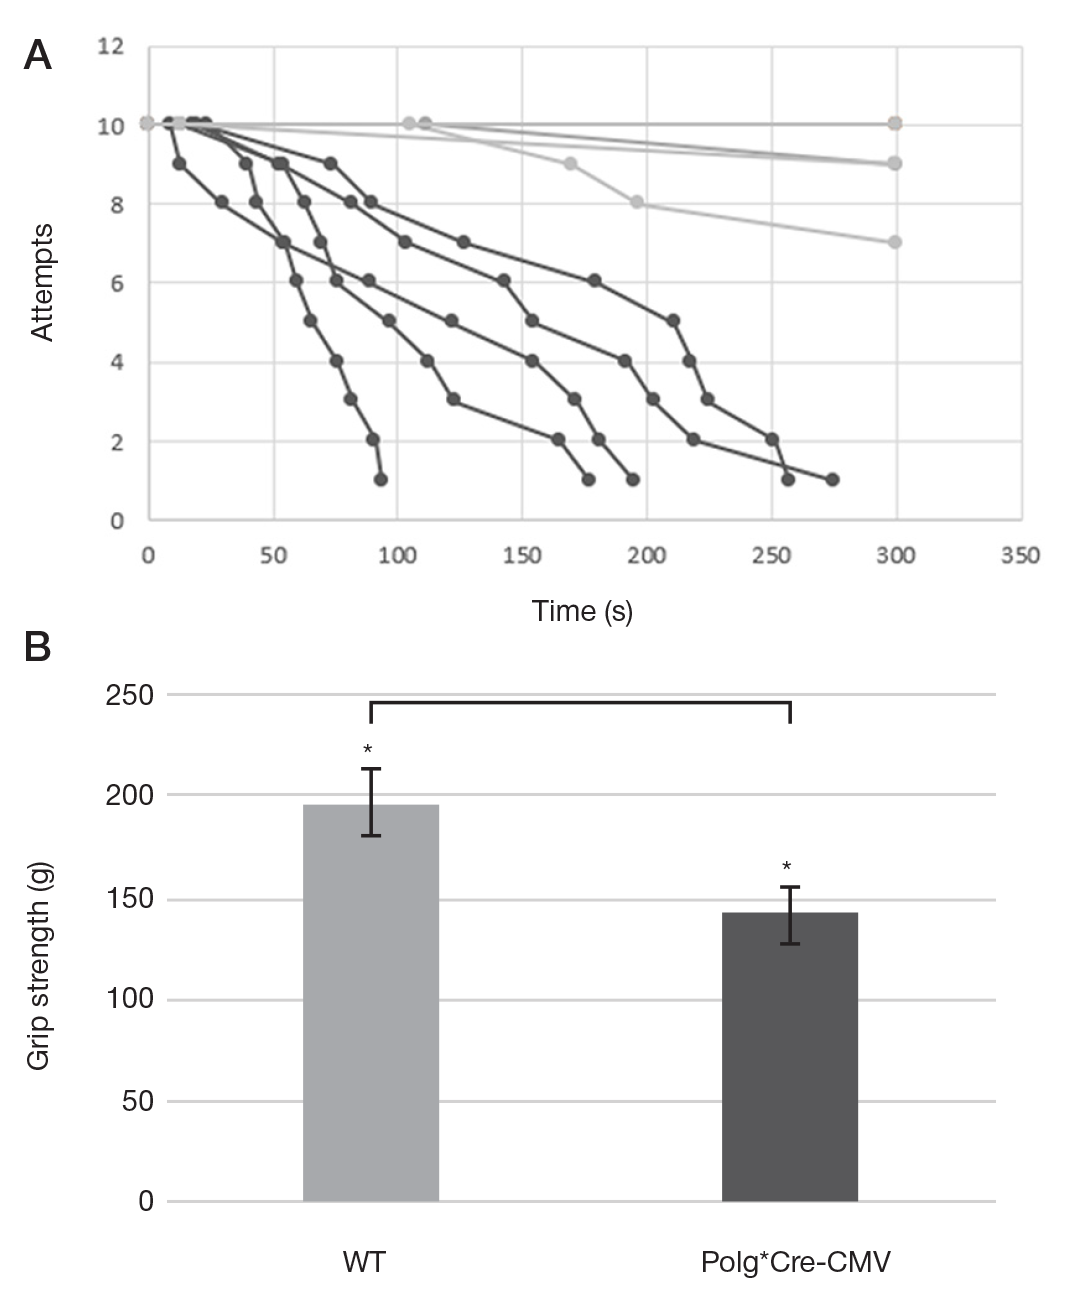
Fig. 3. Results of muscular endurance tests for Polg*Cre-CMV mice (dark-gray) and wild-type controls (light-gray). А. Wire hang test. B. Grip strength test. * — significant differences
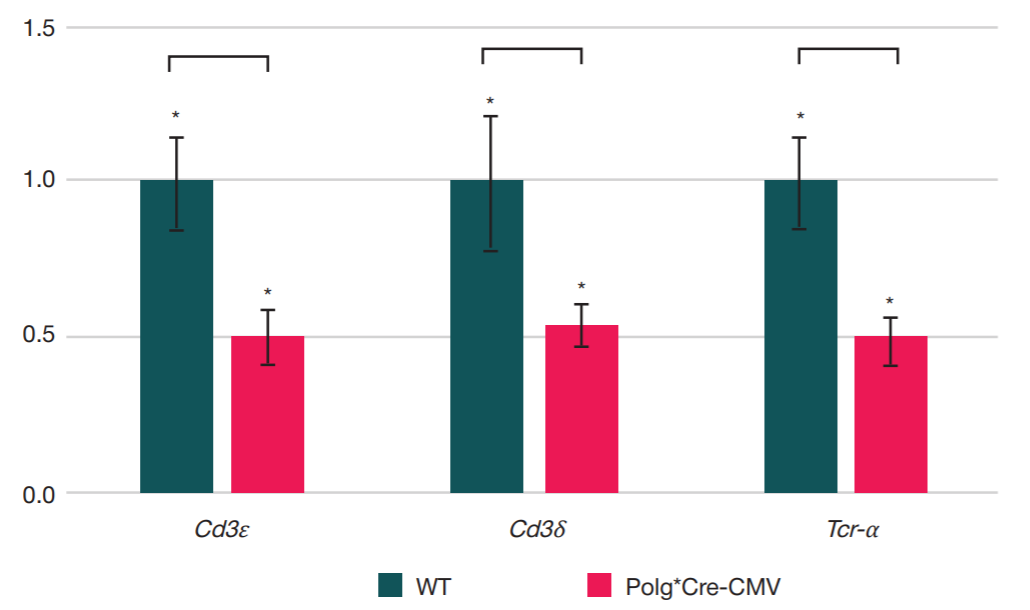
Fig. 4. Decreased expression of Cd3ε, Cd3δ, and Tcr-α in mixed splenocytes of Polg*Cre-CMV mice compared with wild-type controls. * — significant differences
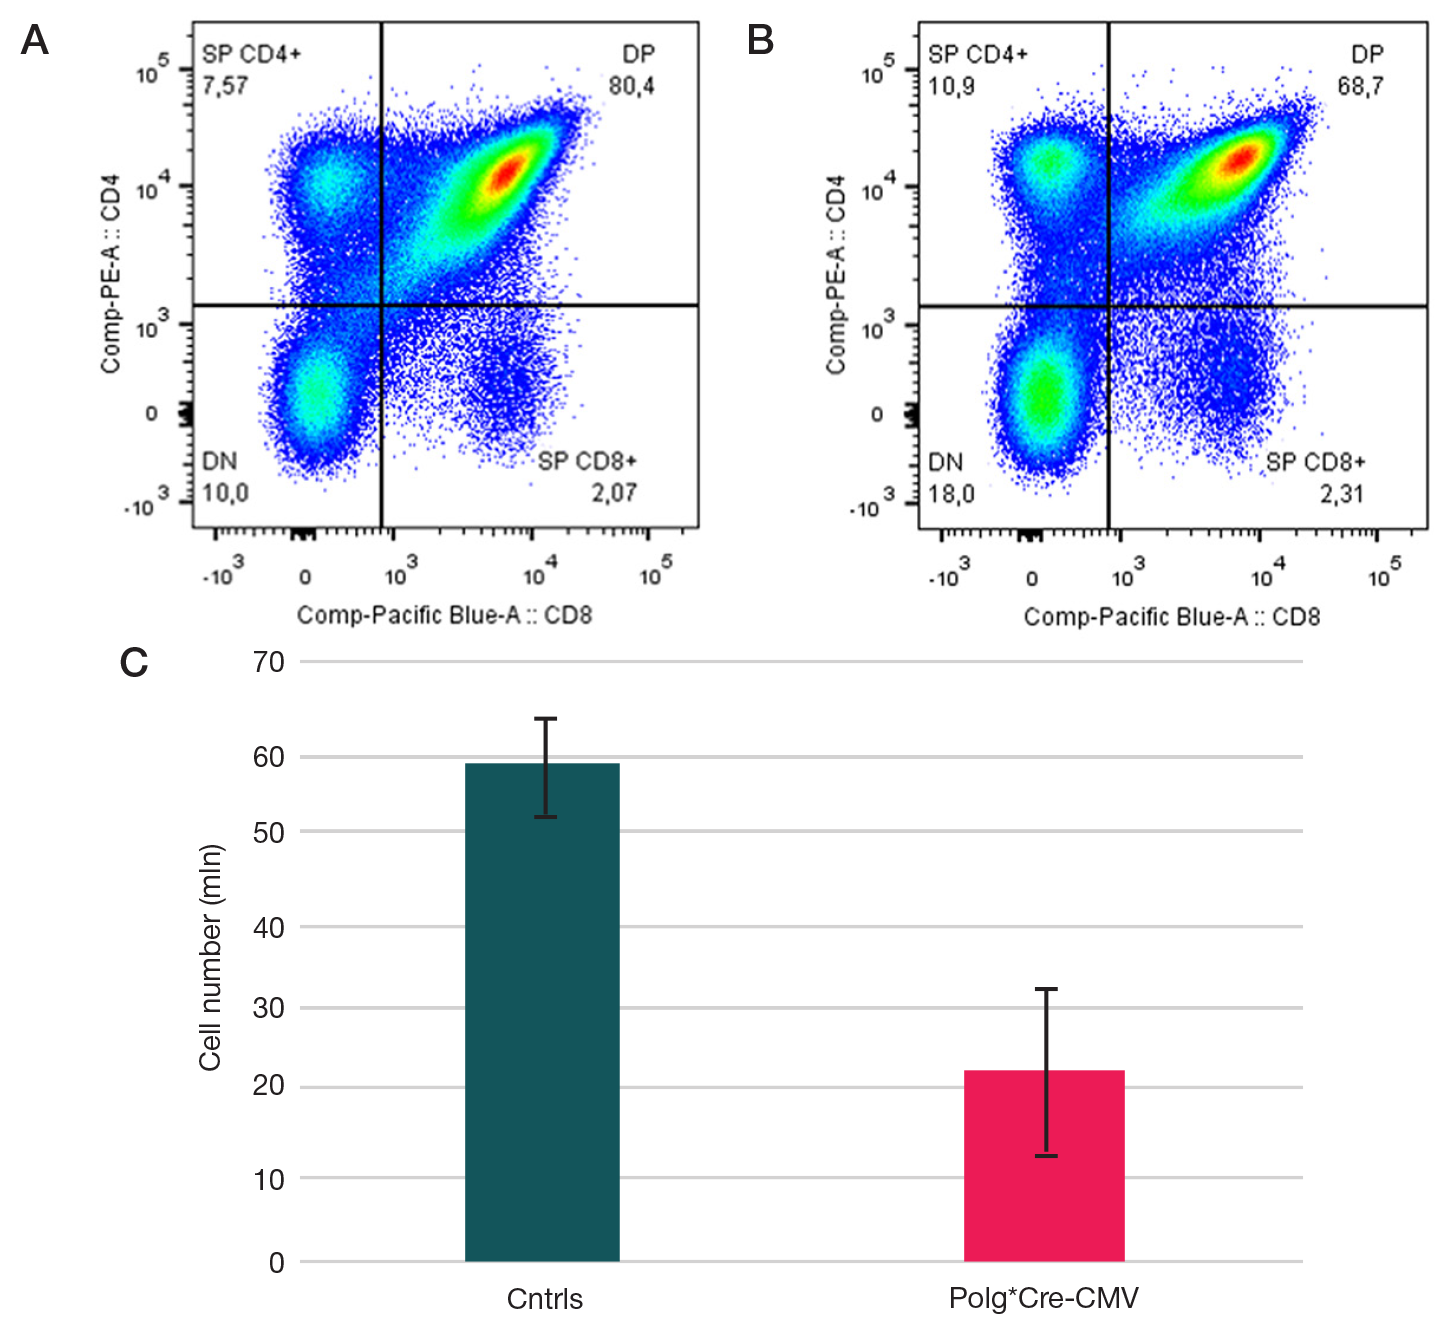
Fig. 5. CD4/CD8 dot plots for the single-cell suspensions of thymus cells from Polg*Cre-CMV transgenic animals (B) compared to wild-type controls (A) and a histogram of thymus cell counts (C). * — significant differences
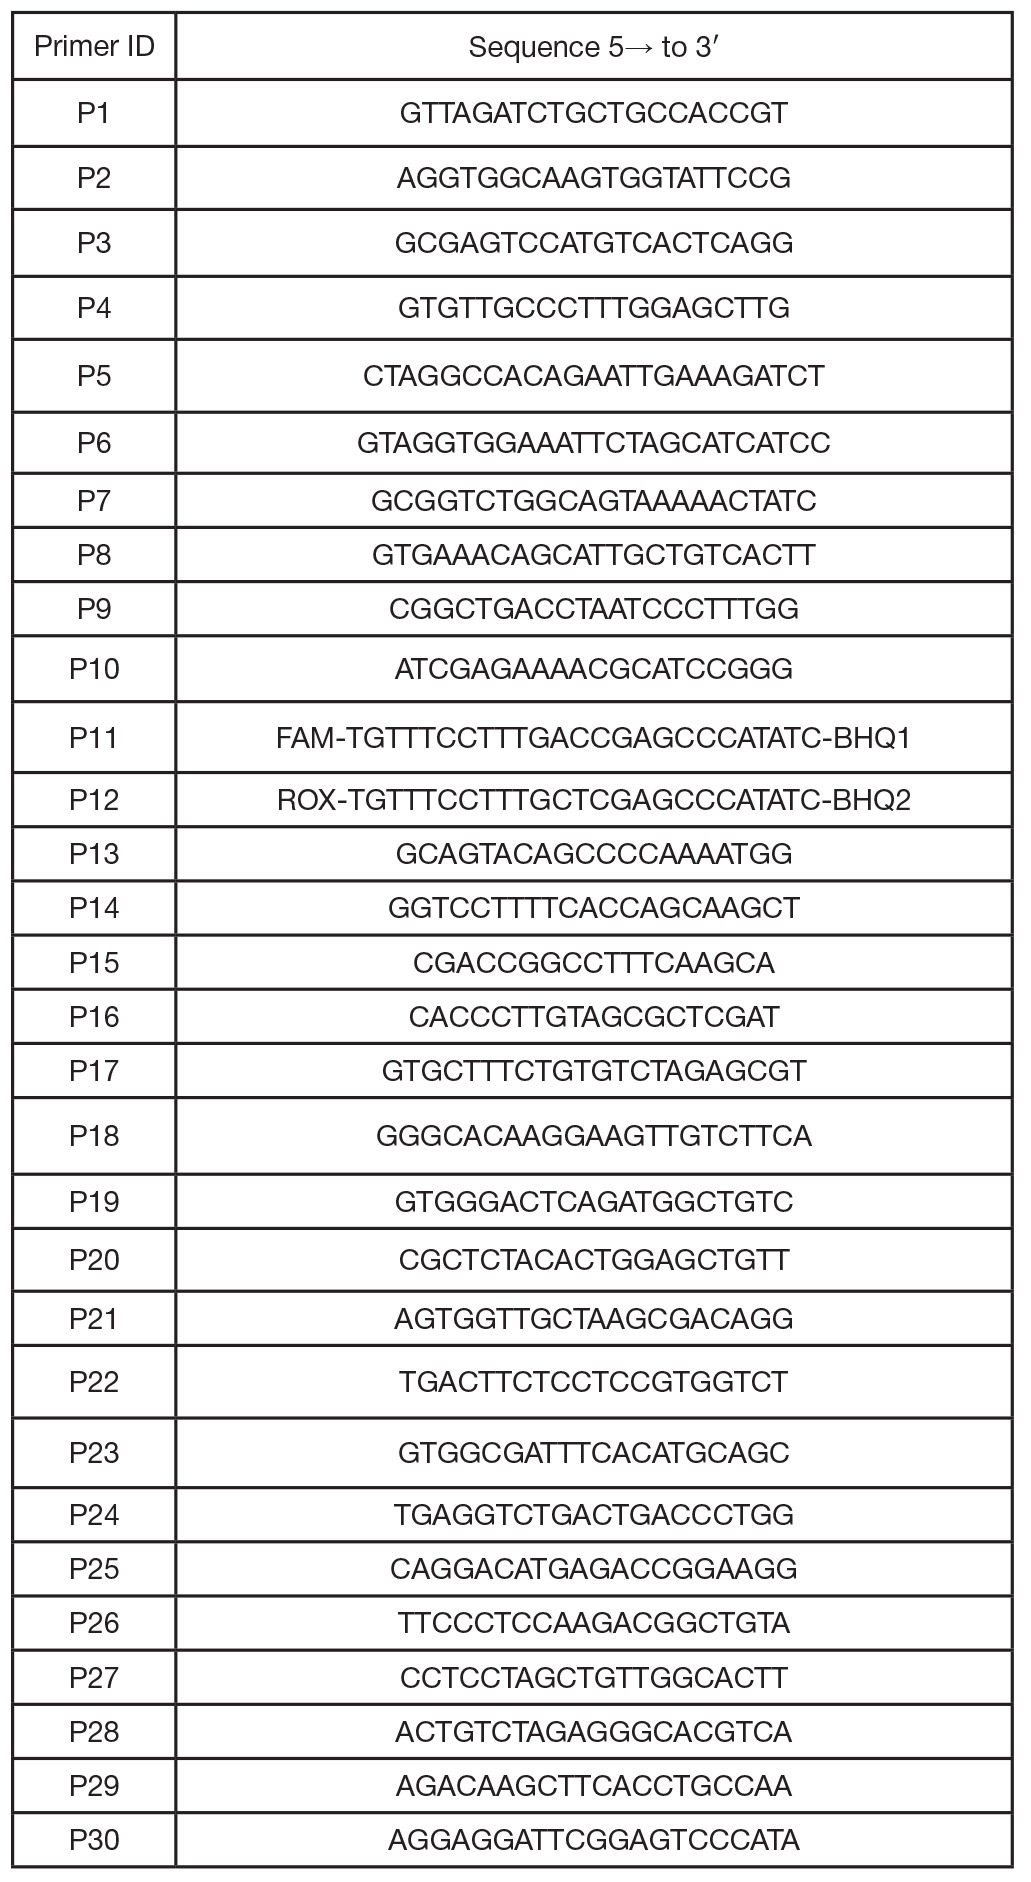
Table. The list of primer sequences used in the study